Boss Mode: Siemens Web Server Part Two
If you missed it, check out Siemens Web Server Part One here.
Building Powerful User Pages
With user pages enabled in the PLC’s web server, we can now expand into dashboards, reports, trends, APIs, and more. What you choose to do with your pages is entirely dependent on your needs. We will cover some of the common use cases we have implemented on most of the web-based systems we have developed over the years.
General Concepts
While it’s possible to include all of your HTML and Javascript/jQuery code in your user pages directory and on the PLC itself, it can be beneficial to host the files on another machine on the network, or use a content delivery network (CDN) to deliver the files needed for client-side functionality. Including these files directly in the PLC can use large amounts of memory—potentially impacting your data logging capabilities. Hosting these files on a different machine or a CDN alleviates these issues and can also decrease page load time.
This article will demonstrate how to use a CDN to deliver the jQuery libraries we will be using. In line with hosting libraries outside of the PLC, we have found hosting a Javascript file on another machine and updating it during development saves a lot of time compared to generating blocks for user pages, compiling, downloading the processor, and rebooting every time a change is made. Using a different machine allows you to edit the Javascript file on the machine, save it, and simply refresh the browser to update the page with any changes. This results in significant time savings over the course of developing and testing a full application.
We will cover the various functionality components below, in no particular order. At this point you can jump around the article to find what interests you most and work through the exercise without a whole lot of overlap between sections.
Basic Trending
The data log functionality of the S7-1200 or the S7-1500 is a powerful tool you can use in your user pages with trending. Given the relative simplicity of most web servers (including the one in our PLC) we will focus on implementing client based trending tools through the use of Javascript and jQuery. There are a variety of frameworks you can use: D3, High Charts, Google Charts, or our framework of choice, Flot Charts. Each framework has their pros and cons, some including license ramifications, open-source vs. closed source, and free vs. paid. We have found Flot Charts work extremely well for our needs, which typically trending time-stamped process data.
If you have any questions about our experience with any of the tools we have used, please feel free to contact us. In this section of the article, we will generate a date/time range using date/time pickers on the page. When the user selects the date range and clicks the "update" button we will request a list of data log files. Based on the filenames—including when the date/time the logs began—we will select the appropriate file, parse its contents into the format required by Flot, and then display the trend to the user with the correct date/time range on the X-Axis.
From A Data Set
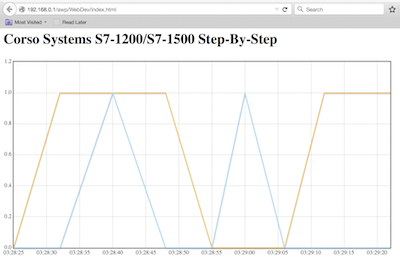
First, we will generate a basic trend with a fixed data set. Next, we will implement dynamic datasets with date range selections. To demonstrate basic trending, our PLC has a small log file tracking the run status of two pumps as seen in the chart.

Data logs are stored as .CSV files in the S7-1200 and S7-1500 PLCs. This format defines the value of each column in the first line, with each column separated by a comma. Subsequent lines represent values at a particular timestamp, again with each column separated by a comma. This format, while useful for storage and analysis using a program like Excel, isn't directly useful for the approach we will take to generating a trend.
Using jQuery-CSV
First, we need to break the CSV data down so that Javascript can use it more effectively. To accomplish this, we will use a jQuery library called jQuery-CSV. This library allows us to convert the CSV file into a list of objects we can easily manipulate to work with using Javascript. Following the tip to load libraries from a CDN, we will load the library from a CDN in the header of our HTML page. Keep in mind you can use any CDN you prefer, store the file on another machine on the network, or even put it directly in the PLC as necessary. Since we will be using jQuery libraries, we will also include the jQuery library itself:

We will do the same thing for the Flot Charts library, and for development purposes, the development version of the Javascript file we will use for testing. Since we are dealing with time series data, we will also include the Flot Time library, and the Moment.js library to simplify working with different date formats:
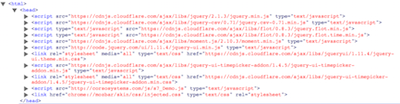
For Flot to function properly, we will need to add a <div> element to our page, and specify the width and height for our trend, and give it an ID so we can refer to it later in our Javascript code:

This is the basic format we need to display a single trend on a page, so we are done with our HTML page for now. Save it to your user pages folder, generate blocks, and download to the processor. We will do the rest of the work to generate a trend in the s7_Demo.js file linked to in the header.
Generating the Trend
Let's go through the code used to generate a trend line by line. If you are familiar with Javascript and jQuery this will be pretty straightforward. If not, it will cover the basics of what is required for this piece of functionality. You can find plenty of resources online to go as in-depth as you like on the language as a whole.
The first line of code tells the browser to execute this code only after the pages has completely loaded. This is to make sure all of the Javascript files and jQuery libraries are ready, and the page itself is loaded and ready for us to interact with it:

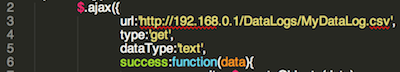
The next section defines an AJAX call to our server. This loads data from the specified URL without the user having to interact with the page. It doesn't require the page to be refreshed. We are specifying the specific URL for our datalog file in the URL parameter, telling the server we are requesting or "getting" data, specifying we want expect the data to be returned as text, and are defining the function we will execute when the AJAX call as successfully completed.
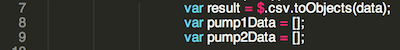
The next line begins the code executing once our AJAX call is complete. The first step is to take the results from our AJAX call (in this case the data in the .CSV file) and use the jQuery-CSV library to convert it to a list of objects that Javascript can more easily understand. This is accomplished by calling the jQuery function to convert a CSV file into objects as described in the jQuery-CSV documentation.
Once this function has executed, we can use the variable "results" to generate the data we will use for the trend. The next two lines as simply declaring variables we will use to store the data for each of our trend lines.
Next, we’ll look at the meat of our Javascript code, where we take the data from the objects we generated from the CSV file and parse them for our trend. We are using a FOR loop to iterate over all of the objects. Within this loop we are pushing data onto the arrays we defined previously. This simply adds a new element onto each array for each object in the list.
Using Flot to Generate a Basic Trend
The format Flot requires for trend data is an array of elements of the form [x value, y value]. For our trend we want the x-axis to display the timestamp, and the y-axis to display the value of each dataset at that time. Flot requires the timestamp data to be in a certain format, so we will have to manipulate the data in our object appropriately.The innermost portion of this function is adding together the "Date" and "UTC Time" columns from our object, with a space separating them. This gives us a human readable timestamp of the format "Month/Day/Year Hours:Minutes:Seconds". To turn this into the format Flot expects (milliseconds since January 1, 1970, 00:00:00) we use the simply use the parse function of the Date type in Javascript as shown below.

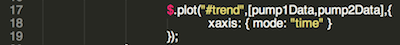
This takes care of the x-axis value, for the y-value we specify the specific data point in our object, in this case Pump1_On or Pump2_On and include it in our elements to be pushed onto the appropriate array.The final piece of code except for closing brackets/parentheses is to generate the plot itself. To accomplish this we call the .plot() function of the Flot library. We pass the ID value of the div we created in our HTML file as the container for the trend to be put in to, specify an array of the variables we want to use for trend lines, in this case the variables we worked with in the previous section of code, and specify a mode of "time" for the x-axis.
This generates a basic trend on our page:
Be sure to continue with part three of the Siemens Web Server series!