Boss Mode: Siemens Web Server Part Three

With the basics of trending covered, let's dive into some more advanced functionality. For our purposes the next step is to add a couple of date/time pickers to our page so we can select a start and end time for our trend. This lets your users narrow down the amount of data they are viewing at any given time and easily view historical data.
Much like trend tools, there are a ton of options for date, time, and both date and time selection options. These can be simple HTML dropdown controls, or more complex jQuery components with additional functionality. For this tutorial we will use a jQuery date/time picker we have found to be very mobile friendly.
This date/time picker control is an add-on to an existing library of user interface controls called jQuery-UI.
To make it functional, we need to include the jQuery-UI library, as well as the files for this particular control. For the rest of this article, assume we will be adding the required lines to our existing file. To save some space we won't keep repeating previous lines of code:

Notice we are also including references to two CSS files, these contain all of the styling for the various controls and will start to become more prevalent in later sections.To place a date/time picker on the page we need to add a div for each date/time picker we want to use, give it an ID so we can access it in Javascript, and then write the Javascript code we need to generate the control. Let's start with the HTML and break it down into further detail from there:

The Code: Date Picker & Update
This code is pretty basic, we have an input for each of the datetime pickers, and an update button we will use to trigger a page update when the user changes the date range.
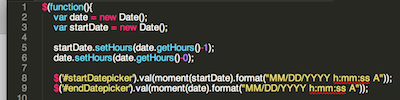
This code will go right below the $(function() call, so it is the first thing to be executed when the page loads. This is going to be a little more involved than simply creating the date/time picker to give us additional functionality by pre-populating the pickers. The first two lines define variables and set them to a value of the current time/date. The next line sets the startDate variable's hour to one hour ago, and the next line is there for posterity in case you wanted to choose a different range than simply the previous hour. The final two lines create the date/time picker and pre-populate their values with the start and end dates, with the correct formatting specified by the Moment.js library.
Now, when you load the page you will have two date/time pickers, with one at the current time, and one at the current time minus an hour. With the date/time pickers set up, we can put them to use. This will be one of the more complex portions of the process so far and will cover a lot of different concepts. The basic outline is the page will load with default values for the date/time range, or user will make an adjustment to the range and click the update button. We will get a list of the datalogs and their "last modified" timestamp. Then, we’ll figure out which datalog best matches with the date range, and load it the same way we did in the previous section. We will leave some items for your own future exploration such as more in-depth interface design and working with date/time ranges spanning multiple data logs.
Implementing the Update Button
We need to know when the user clicks the update button. Using jQuery this is extremely easy using the onClick() function.
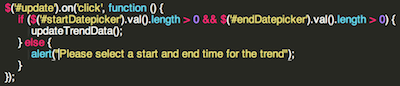
This code checks to make sure the date/time pickers have a value and if they do, it calls the updateTrendData() function. If they are empty, it alerts the user to make a selection. We can accomplish the same functionality when the page loads by calling the updateTrendData() function after the date/time pickers have been created as in the previous section. The meat of this section is what happens in the updateTrendData() function.
The first portion of this function needs to determine what datalog file we need to use to populate our trend, based on when it was last edited in relation to other datalogs that may exist. We are going to make an assumption to simplify development. The assumption is datalogs will only be modified as data is added to them, and once a new datalog has been created, we will assume its start time is later in time than the previous datalog's last modification. This allows us to use the datalog information available by default to narrow down the file we need to load without having to go into the PLC code and do anything like provide a timestamp as part of the datalog name when it is created. In this case simple is better.
Getting the Timestamp Data from the PLC Datalogs
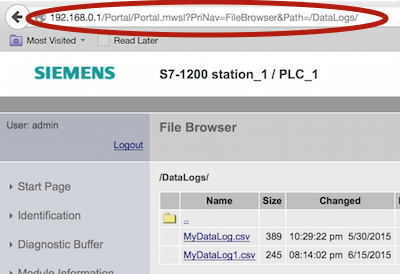
How do we get the timestamp data from the datalogs in the PLC? If you navigate through the built-in pages in the S7 web server you will find a list of the data logs, with an associated timestamp of when they were last modified. What we will do is load this page using an AJAX call like before so the user doesn't need to interact with the page to load the data and no page refresh is required.
When the page is accessed using AJAX we can then search through the HTML to find the timestamps based on the CSS class of the table and the corresponding cell within the the table and iterate over those to build our list of timestamps. Once the list is created we can do some simple comparisons to find the closest matching datalog file and call the function to load it the same way as before.
We are going to make some big assumptions for this tutorial. First, we will assume you are generating datalogs on a regular basis. Second, we will assume your datalogs are only storing a relatively small amount of data (one hour). Lastly, we will assume that you will only want to look at the data contained in one file. It is entirely possible, with some additional code, to view data from multiple files at once, use files for any length of time, and do things like "real-time" updates.
Functionality in those areas is something we can discuss further, but are out of this article's scope.The first step is to get a list of the datalog files stored in the PLC. We will use AJAX again to accomplish this task. Navigating through the standard webpages, we find a list of data log files and the URL we can use to access the list.
Using this URL in our AJAX call
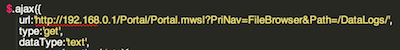
Upon successfully loading the page, we will return its contents as text to our AJAX function for further parsing and manipulation. First we will declare a variable, set it equal to the response text, and wrap it up with <html> tags so we can manipulate the data with jQuery

Next we will declare variables to hold our start and end timestamps from the datetimepickers.

The datalog file information is stored in a table. We will simply copy this to our page to simplify the code for this tutorial, and hide the table so it doesn't clutter up the page.

Iterating Through the Table Rows
We will iterate through the rows of the table, checking to see if the row contains a timestamp. If it does, we will parse it into the Javascript format and compare it to our start and end timestamps to see if it is in our desired range. If it is in the range, we will get the filename and generate the trend. If it’s not in our range, we will simply move to the next row in the table. Most of this code is similar to what we have seen previously, the main difference is navigating the table.
This function is called in two places. First it will be called when the page loads, and should load the latest datalog and display it on the trend. The second place it is called is when the user clicks on the "Update" button next to the datetimepickers. In this function we are iterating through the rows of a table. By viewing the page source in our browser, we can see what the various IDs and CSS classes each cell in the table has applied to it. Using this information we can easily find the timestamp and filename in the row using jQuery.
First we will use the .find() method to determine if the timestamp cell has a valid timestamp using CSS classes, and the length of the text in the cell:
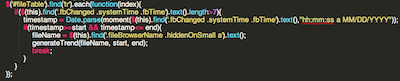
If we do have a valid timestamp we wlll parse it as before and check to see if it is in our desired range. If it is, we will navigate to the filename cell in this row and pass the filename to our function to generate the trend.
generateTrend(fileName, start, end);
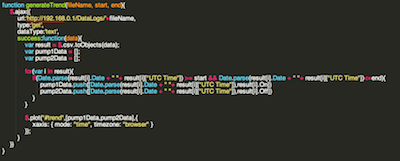
In the previous section we demonstrated loading a single datalog file. In this section we moved this functionality into a separate function, including variables for our date range to limit the amount of data we are loading from the datalog. This is the same code as before, wrapped up in a function, with a check on the timestamp in the datalog to see if we need to include it in our trend. We are calling this function from the updateTrend() function in the previous section.
Wrapping Up
Now you have the functionality in place to load datalogs onto your trend using a user-selectable date range. Simply changing the date range and clicking "Update" will go through the datalogs in the PLC, find the appropriate file and display it on the trend. Where can you go from here? Possibly simplify the process by removing the date range selection, generating a table of the datalogs and allowing the user to click on a particular file to display it on the trend.
Another option to provide flexibility along with more backend complexity would be to load data from multiple datalogs to fill your date range with any data in the PLC. A third option would be the addition of "real-time" trending, allowing users to see the most recent data as it is written to the PLC. The Flot website has excellent examples of this functionality, and if you have any questions on how to implement any of these ideas or any you have, we are always happy to help. Contact us today!