Boss Mode: Siemens Simatic Information Server
You may want to check our the Siemens Web Server parts one, part two, and part three. After implementing KPIs in WinCC Performance Monitor, you will need a way to visualize your plant's performance. Simatic Information Server gives you an easy way to build reports and other visualizations for analyzing your data. Use it as the information necessary to run your process at the highest standard.
Reports and Dashboards
Simatic Information Server saves you time. You will no longer need to spend an afternoon troubleshooting that calculation in Excel which is making your KPIs go off the charts. You won't have to spend energy compiling information in multiple formats to make everyone on your team happy. And, you don't have to worry about getting the reports sent out on time.
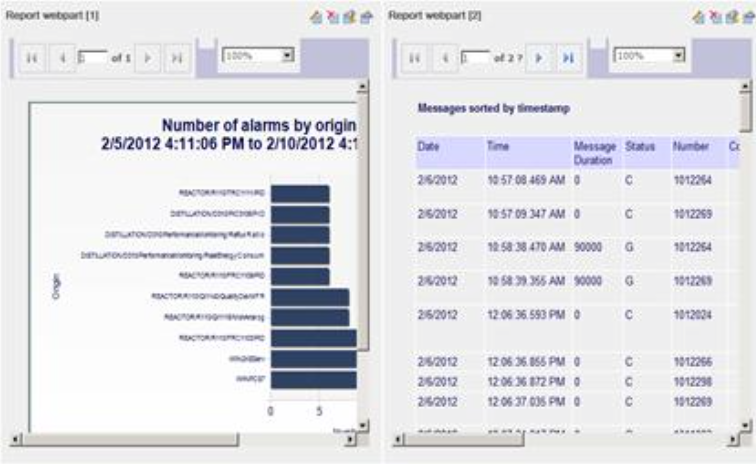
With Simatic Information Server, your KPIs have already been generated, and you can quickly create reports in Excel, Word or PDF formats using out of the box templates. You can automatically send out reports on a schedule.
In addition to the report templates, you have full access to modify the existing reports or create your own from scratch. Custom reports can also be used to display information from other systems you may be using, giving you even greater access to information across your entire organization.
Ad-Hoc Reporting
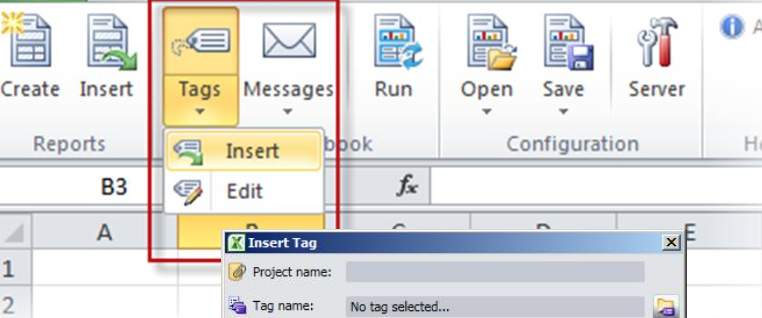
Information Server also includes Microsoft Office Add-ins, giving you the ability to import data into Excel on-demand. This can allow your staff to get the information they need, anytime they need it. Unlike other platforms, this will save you from needing to create custom reports for every single person who wants to access performance data.
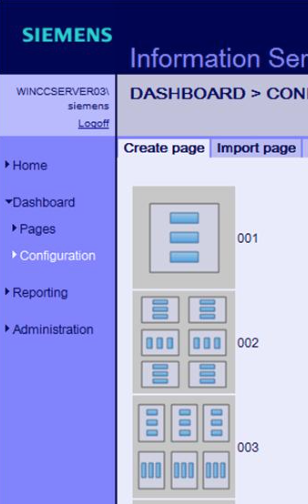
If you are familiar with the reports from another performance management system and are now using Simatic Information Server, please let us know, we have already done the legwork of implementing many reports from other systems into Simatic Information Server's format. You can also utilize dashboard functionality in your reports to let anyone in your organization view information at the right level of detail for their needs. This functionality has been built into the same interface used to manage your reports.
Unlike other platforms, you do not need to open a separate program and convert your dashboard to fit into the right format to be useful.
Trending
In addition to reports, you can display all of the data from your WinCC Performance Monitor system in your existing WinCC applications. Using standard trend tools explicitly built for KPI tracking, you can display KPIs faster than it took you to read this article.
Business Systems Integration
If you have any systems elsewhere in your business, you can easily integrate WinCC Performance Monitor information with their workflows using Siemens' Industrial Data Bridge tool. For instance, if process downtime directly affects product quality testing schedules, you could automatically notify your quality technicians of process upsets on particular product runs. This will allowing them to schedule their time more efficiently. Another example is if product quality directly affects shipments timing—the shipping department can be immediately notified of upcoming delays. Then, they can manage customer expectations as necessary to maintain customer agreements.
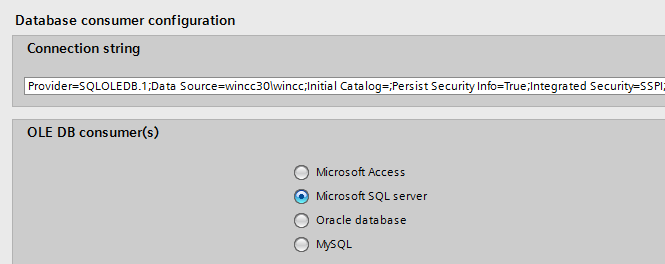
Integrating with your business systems is likely more complicated than implementing Siemens' performance management suite in the first place. However, you can work with your IT staff or outside developers to access this data directly from the database. We have leveraged this capability for many of our customers with great success. All of the information is available for you to use and you can structure your data in the most efficient way possible for your systems.
T-Minus Time to Success
Implementing the reporting and analysis tools using Simatic Information Server is a rapid process. Using report templates gives you access to the most common information impacting your bottom line. And, if something is not immediately available in the stock reports, you can quickly build your custom reports.
Possibly the most important question is why wouldn't you want to access all of the information about your processes? If you could increase capacity, reduce costs, and enable continuous improvement using the equipment you already have—along with better info—would that improve your bottom line? Read all the Boss Mode Posts.


