P&ID Drawings 101
We live in an exciting time. With Ignition’s Perspective Module, any information about a process or business system can be in the palm of our hand. Map-based tools allow us to manage world-wide deployments of equipment and process control systems, and grant permissions and functionality based on a user’s physical location. We can even run entire manufacturing operations using software in the cloud without needing to even buy a computer.
However, manufacturing processes are still complex operations with many moving parts, data to collect, and information required for operators to run the process safely and efficiently. While the technology for building these tools has advanced in leaps and bounds over the last twenty years, the tools for building and managing these systems has remained largely the same. Yes, we are talking about the humble Piping and Instrumentation Diagram, or P&ID.
In this post, we will review the basics of a P&ID Drawing and how to interpret the various lines and symbols. The next post in this series will teach how to understand a P&ID along with a control philosophy for describing how the process operates to build a mental model of how everything works together. The final P&ID Drawing post will combine the concepts from the first two posts and show you how to build SCADA screens from a P&ID and Control Philosophy.
Let’s dive in!
What is a P&ID Drawing?
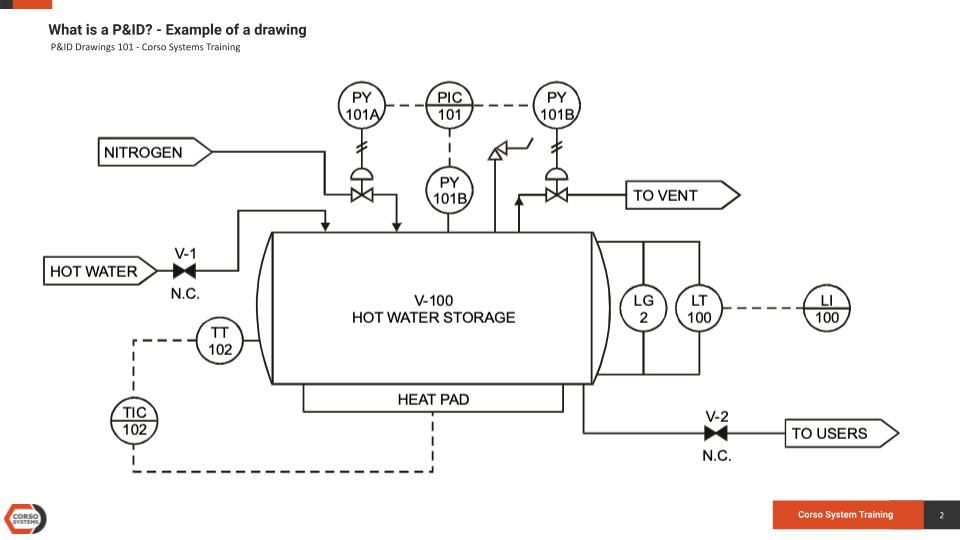
P&ID is short for “Piping and Instrumentation Diagram”. A P&ID uses simple graphics to represent complex processes and convey the flow of material through a process. It shows the equipment used in the process, and all of the signals required to measure and control the process.
This example above is obviously simplified, but gives us a good starting point for displaying the types of graphics you will see on many P&IDs. We will examine a more complicated example later in this post.
P&IDs will typically include:
Mechanical equipment named and listed numerically
Valves and their identifications
Process piping, sizes, and identification
Vents, drain, special fittings, sampling lines, reducers, increasers, and other miscellaneous items
Permanent start-up, flush edges and flow directions
Interconnections reference, control inputs, outputs, and interlocks
Seismic category and annunciation inputs
Computer control system input
Vendor and contractor interfaces
Identifications for outsourced components and subsystems
The estimated physical sequence of the equipment and its rating or capability.
***Important Note*** P&ID (Process and Instrumentation Diagram) is not to be confused with PID Control (Proportional, Integral, Derivative), which is a type of process control loop. You will see both terms in this post. Yes it is confusing to have the same three letters make up an acronym you’ll likely see on most automation projects. We agree that is not ideal, and to help make sense of all of it you can check out our ever evolving Automation Glossary page for more information on any of the terms you might run into.
PID is used to control a variable, like motor speed or valve position, based on process conditions to try to maintain an operator setpoint and isn’t covered in much detail in this presentation.
How to Read a P&ID
The first part of understanding a P&ID is learning to identify the types of devices displayed on the diagram. Using industry standards, we can typically group all equipment into a 3 letter or less abbreviation. Sometimes you will use more letters, but 2-3 letters cover the vast majority of use cases. Lucidchart has a number of standard symbols and identifiers in their P&ID symbol legend.

Some common abbreviation examples are listed in the chart above. On a P&ID drawing, these abbreviated indicators are typically shown inside of a circle, diamond, square, or some combination of these shapes. You will see many examples of these in this post.

Callouts for individual instruments and equipment on the P&ID will be contained in a circle, square, diamond, or a combination of the shapes.
Typically, instruments which are not tied into an automation system or PLC will use only the circle. But, devices with a signal going to/from a PLC will use the circle within a square. Although some P&IDs will use the diamond in a square as shown in the chart above.
The right side of the chart above has examples of partially completed out instrument callouts like the FC for Flow Controller.

You will also commonly see “double” callouts such as those on the bottom of chart above (or near this paragraph in the small image) where two or more items are directly adjacent to each other. This indicates that these callouts are either part of the same device, or are somehow related to that device. An example from an exercise later in this post is shown here in red: a Flow Element, a Flow Transmitter, a Totalizer, and a Low Low Flow Alarm all connected, indicating they are all part of the information coming from this flow meter. The FE signal is the sensor itself, and the FT, TOT, and FALL are signals that go to/from the PLC as indicated by the square surrounding the circle.

A Real-World Instrumentation Example
A real-world example of a device with a flow meter is pictured above. The bottom half of the device is labeled “Sensor” and is installed in a pipe to detect the flow of fluid through the hole in the bottom of the device. The sensor then converts this flow into a value using electronics that allow the transmitter to display both a value on the LCD screen and with a signal to the PLC.
On the P&ID, the callout FE-2001 would refer specifically to the sensor portion of the instrument. FT-2001 would refer specifically to the transmitter portion. Note that FIC-2001 and FALL-2001 are related values to the device, but are not physical devices, instead they exist in the PLC.
Typically, equipment like valves/pumps/etc. that are tied to a PLC will have a commanded position/speed/etc. coming from a PLC. For equipment with an associated controller (like FT-2001 and FIC-2001), there will be an associated operator setpoint. This will be described in further detail later in this post.
As a rule of thumb, on the HMI we would refer to the transmitter specifically when calling out this device. From a controls point of view, FE isn’t relevant—because you wouldn’t have a transmitter without some sort of sensor. The element is generally not a type of signal we can use directly, so it needs to be converted, and the transmitter is what sends the signal to the PLC. We would also not typically call out the FIC or the FALL specifically on the screen. We will use values from the FIC on the screen, and the alarm will be configured to generate an alarm based on the reading of FT-2001.
For some cases (like a low level or high level float switch in a tank), we would use a circle graphic on the screen to represent the device because it is either on or off. In contrast, a flow transmitter will have a range of values.

In addition to automation information (such as instruments), P&IDs also provide details regarding the piping between equipment. This information typically includes pipe sizes, pipe material types, how different pipes are connected, and if there are any valves, orifices, reducers, or other types of pipe accessories.
Many common pipe symbols you will see on a typical P&ID are listed in the chart above. Although for most automation projects, these symbols aren’t particularly useful as we are more concerned with instrumentation and equipment information. So, on an HMI screen, you will typically only use lines to represent pipes—and not any particular piping symbols beyond direction of flow arrows (unless the customer requests specific details).

Putting the “Pipe” in Piping & Instrumentation Diagram
Pipes connect tanks together, but the second most common item you will see on P&IDs are tanks/vessels. In the wild, there are many different types of tanks and vessels. But generally, the tanks will fall into one of the categories represented in the chart above. But there can be design variations based on the process or the design engineer.
From the chart above, we will commonly see vertical/horizontal vessels, tanks, tray columns, and some form of cone roof tanks. Usually a tank will have pressure, level, or temperature instrumentation associated with it, as well as valves and pumps to fill or empty the tanks as required by the process.
P&ID Symbols: Heat Exchangers

Depending on the project, we may or may not see a number of heat exchangers represented on P&IDs.
The chart above has some of the most commonly used types of heat exchangers: plate & frame, shell & tube heat, single pass, heater, air cooled, heating exchanger, and boiler. Based on the piping going to each heat exchanger—and what equipment it is coming from—you can usually deduce which fluids are getting heated and cooled.
P&ID Symbols: Pumps

Just about every process that involves liquid will use pumps. While you will sometimes see symbols for triple blade fans representing a motor spinning a fan, or a generic motor graphic used on a conveyor, for the most part anything listed in the pumps chart above will be touching fluid.
Centrifugal pumps, gear pumps, vertical pumps, and vacuum pumps are the most common in diagrams. Similar to heat exchangers, you can deduce what is being pumped based on the pipes going to and from the pump.
Generally, pumps are also connected to a control loop and instrumentation. Whether to measure flow, pressure, or level, the pump will be used to control the desired value based on the process.
P&ID Symbols: Valves
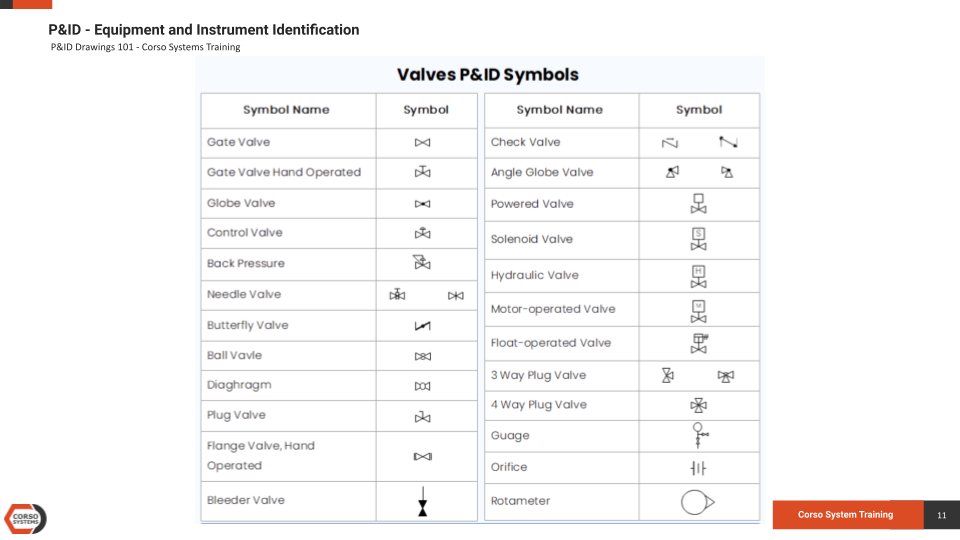
Finally, any process involving liquids or gases will definitely have at least one valve. Valves can be manual or automatic—open/closed, or actuated. Actuated valves can be opened to a particular position from 0-100%. Typically there will be a range of values for a “Valve is Open” or “Valve is Closed”, or the valve may have open/closed feedback using a limit switch.
Open/Closed valves are usually solenoid valves and are either open or closed. They can be toggled by a control signal.
From an automation perspective, we are not terribly concerned about what type of valve (globe, gate, butterfly, etc.) is being used. But, we do need to know if if it is manual or automatic, and if it is actuated or a solenoid valve. Depending on the process, it will sometimes make a difference on which type of valve is used, but it generally doesn’t impact automation, especially HMI screen design.
Valves which are filled in with black are “Normally Closed” (the valve is closed under normal process conditions). Usually, this will also mean the valve will fail closed if it loses a control signal, but not always. Generally, valves are either allowing or blocking the flow through a pipe. But, depending on their control signal, 3-way and 4-way valves can change the flow from one pipe to another.
P&ID Signal Lines and Instrument Line Symbols

In addition to pipes, you will also see signal lines connecting pumps/valves/instruments to devices on a P&ID. These lines also indicate where the the control signal for a given device comes from. These lines may or may not be the same as shown in the chart above, but should be defined in a legend on the P&ID for your particular use case.
From an automation perspective, we are mostly concerned with the electrical connections and internal system links described on the chart above. These indicate what the signals control, and which devices are involved.
Wrapping Up
While we covered a lot of ground in this post, it should give you everything you need to know to understand what is on a P&ID drawing. If you need more resources, please check out the LucidChart P&ID Symbols document listed above. Or for a more official (read: paid) option, you can check out the ISA Instrumentation and Symbols documents on ANSI.org. We use both of these resources extensively in training our own staff members here at Corso Systems.
If you aren’t 100% up to speed on every detail of a P&ID drawing after reading this post, just keep practicing and you’ll quickly make sense of it. Keep in mind there are entire college courses dedicated to understanding and creating your own P&ID drawings, so it might take a little bit of effort to wrap your head around all of it.
In the next post we cover reading a basic P&ID drawing, and the post after that will show you how to turn a P&ID into an HMI screen.