P&ID Drawings 201: Reading Real World Examples
In the second post of our P&ID series, we will be working through an example of a simplified drawing. If you missed the first post in the series, P&ID Drawings 101, please review it first.
The following diagrams will have more detail than in the first post. And in addition to the P&ID, it can be helpful to have a control narrative for the process. The process narrative for this P&ID is displayed below:
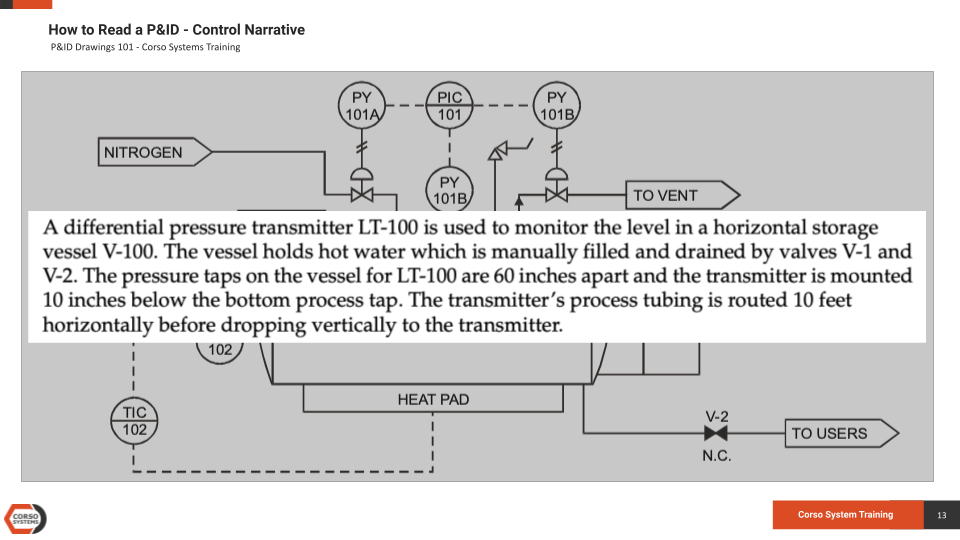
Our example above shows a horizontal storage tank (V-100) that holds hot water. It is filled and drained by valves V-1 and V-2. The tank has pressure and level sensors for monitoring and controlling the pressure and water level.
The tank also has a heating pad to control the water temperature.
The P&ID also displays the flow of fluids into and out of the tank, with indications of where the fluids are going.
On its own, a P&ID won’t tell you EXACTLY how a process works, but you should be able to figure out where parts or materials are going—along with what types of operations are happening at any given step along the way.
Reading a P&ID: Process Fluid Flows
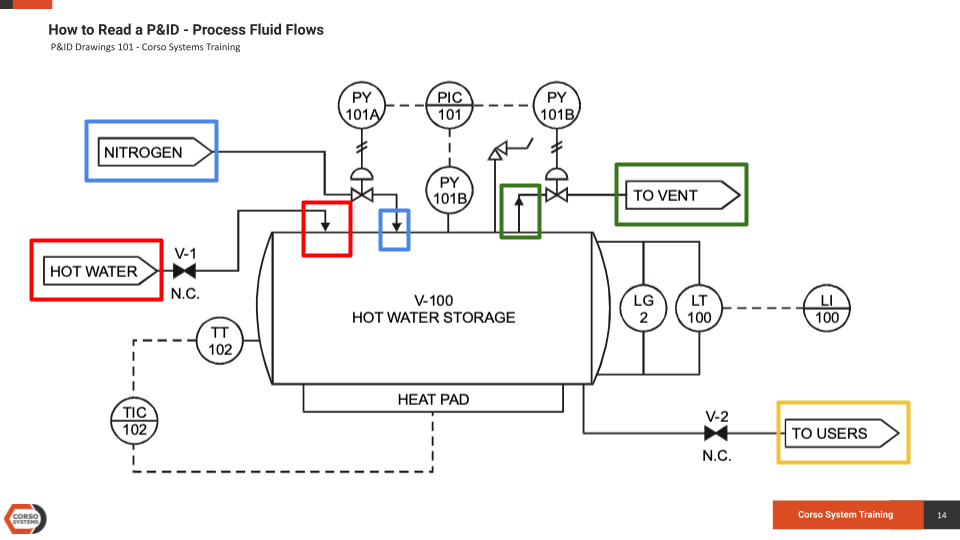
In the P&ID drawing above, the flow of nitrogen into the top of the tank is highlighted in blue. It exits the tank where the diagram is highlighted in green.
The point where hot water enters the tank is shown in red. Then, in yellow we see where the hot water leaves toward the process that requires it from this tank.
The lines representing pipes on the top of the tank indicate whether the fluid is going into or out of the tank. Since there is only one pipe on the bottom, it has an arrow indicating its direction.
Reading a P&ID: Temperature Control
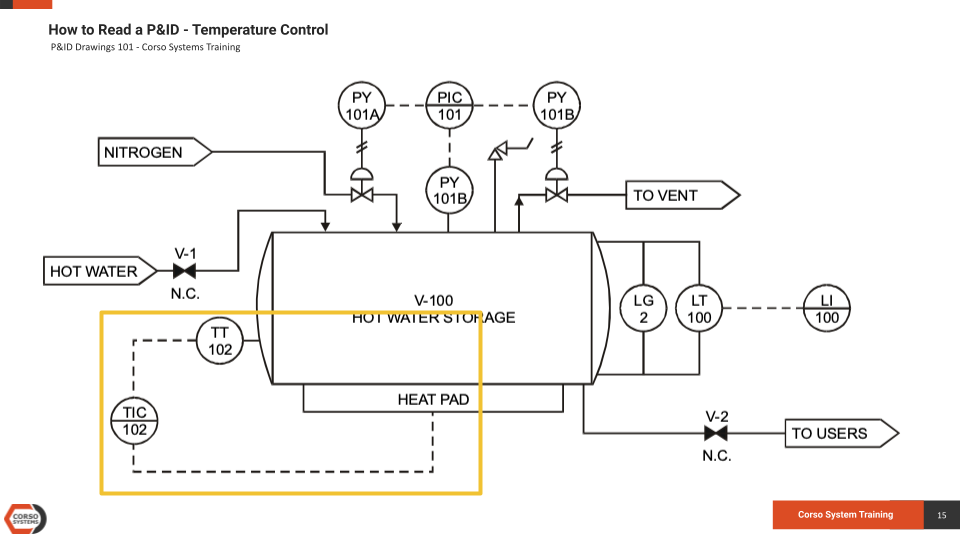
While each P&ID may be different, most will have a legend to define the various symbols and lines. In the example above, we will assume that the thicker solid lines are pipes, thinner solid lines are physical connections to a device, dashed lines are electrical connections to a controller or an indicator, and solid lines with slashes are pneumatic connections to a device.
Next, we will examine the temperature control loop highlighted in yellow above. The solid line going from the tank to TT-102 indicates that it is a physical connection. Likely, this is a thermocouple inside a thermocouple well. Essentially, this is a small pipe with one capped end which is inside the tank and is connected to a converter which translates its signal to an electrical signal. This electrical signal—indicated by the dashed line—is then sent to a temperature control loop which is likely in a PID controller. This controller is connected to the heating pad, so when the temperature in the tank needs increase, the controller will turn the heater on. If it needs to maintain or decrease the temperature, the controller will turn the heater off.
We know that TT-102 is a sensor because TT stands for “Temperature Transmitter”. You will also see abbreviations like PT for pressure transmitter, LT for level transmitter, FT for flow transmitter, etc. You might also see TIT, PIT, LIT, and FIT for X Indicating Transmitter—an all in one sensor and display.
Similarly, we know that TIC is a Temperature Indicating Controller, and you will also see abbreviations like PIC, LIC, FIC, etc. These abbreviations are based on the P&ID symbol standards, so you will also be able to determine if they are standalone controllers or going to a PLC.
Reading a P&ID: Level Sensors
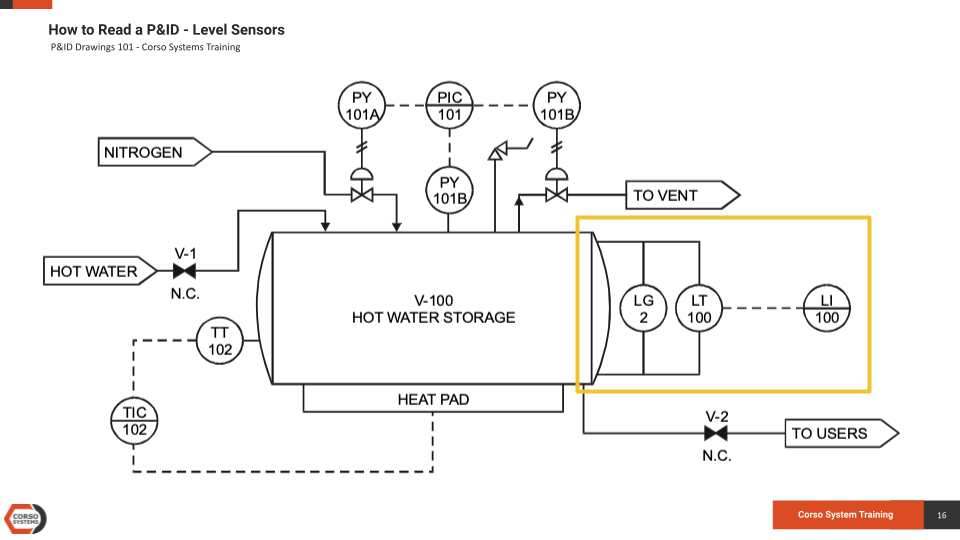
In the chart above, we have three items highlighted in yellow. They’re all involved with the tank level. LG stands for Level Gauge, which is usually a visual tool where the water level is indicated in a sight glass next to the tank. LT stands for Level Transmitter which—based on the text description of the process—is a Differential Pressure (DP) transmitter that calculates the level in the tank based on the difference in pressure between the bottom port and the top port. This transmitter is then connected via an electrical signal to the Level Indicator (LI) which is likely positioned in an easier location for the operator to access (instead of needing to go to the tank).
There is no controller connected to the level. So, we know that controlling the level in this tank requires manually opening and closing valves V-1 and V-2 in various combinations to raise or lower the level.
Reading a P&ID: Pressure Control

The tank’s pressure system is the most complex instrumentation and control loop in this scenario, it’s seen in the chart above highlighted in yellow.
PY-101B on the tank is a pressure converter, which is usually a type of load cell that converts pressure in the tank into an electrical signal. Normally, you won’t see Y as a type of sensor in most industrial applications you will be automating. (Technically it should probably be PY-101C since PY-101B is used on the valve, but that might be a typo on this drawing pulled from another source.)
In this case, the PY is connected to a Pressure Indicating Controller (PIC), which takes the pressure in the tank and—based on the setpoint and control algorithm—will open and close the inlet and outlet nitrogen valves to raise or lower the pressure.
The controller sends an electrical signal to the PY-101A and PY-101B converters which will turn the electrical signal into a pneumatic signal to control those valves. It is safe to assume those valves are labeled PCV-101A and PCV-101B even though they are not written this way on this drawing. PCV Standing for Pressure Control Valve. Similarly, you might also see abbreviations such as FCV, LCV, TCV, etc. on other diagrams.
The funny looking shape to the right of the PY101B coming off the tank is a pressure relief valve for dissipating pressure in the tank should it exceed the limit on that valve. This is common in pressurized systems.
Reading a P&ID: Manual Valves

Finally, in the chart above we have the hot water valves V-1 and V-2 highlighted in yellow. We can assume that they are manual valves since they don’t have any signals going to them. They are using a standard gate valve graphic which also indicates the most simple type of valve.
The “N.C.” below them (and the fact they are solid black instead of outlined and filled with white) shows that they are “Normally Closed.” This means that under normal operating conditions, the valves will be closed, and then only be opened when necessary for the process to get hot water out of the tank, or when the tank needs to be filled.
We can also assume that this means that they are likely to be just open or closed, and not actuated in any way—which we already knew since they do not have any control loop signals going to them.
***NOTE*** There is a “download file” link on the images below. They are pulled in from our internal training materials so the file can’t be downloaded here, although we included plenty of images for reference.

Reading a Complex P&ID Example
The drawing above is from a Biodiesel refinery Corso Systems automated a number of years ago. It has a horizontal tank similar to the basic example from before, but it has a lot more complexity. This tank is part of a much larger biodiesel refinery that takes corn and soybean oil, hydrogenates it in large reactors along with other chemicals, then distills it into diesel fuel.
This tank is the “Cold High Pressure Separator” and is the first operation after the distillation column. The diesel fuel is separated from any remaining water as well as any lingering impurities after distillation in this tank. The distillate comes into this vessel under pressure after it has been cooled, along with hydrogen to maintain the pressurization. Any off gasses go out of the top to the gas headers. Water leaves the bottom of the vessel after it has been removed, and the fuel is then pumped to the next vessel in the process. Due to the tank’s critical nature in the process, it has redundant level sensors for the distillate level.
After we examine this drawing, we will also compare it to an actual HMI screen to demonstrate how to create an HMI screen from a P&ID.

Let’s start at the upper left of the drawing above, and review the relevant areas. Note that in this drawing, the pipes are different colors. The colors indicate the fluid or gas in the pipes, and match the color that the physical pipes are painted in the field. Also note that this does not impact the functionality of the P&ID.
Relevant terms on the diagram above:
RO: Restriction Orifice. The RO is inside the pipe to restrict flow through the pipe. While not a control element or device, “RO” simply indicates that there is an orifice in this pipe, since it is important to the operation of the system.
SOV: Solenoid Valve. An open/closed valve controller with a solenoid. Essentially, this is an industrial version of a lawn sprinkler system valve.
PSV: Pressure Safety Valve. A burst disc that will rupture if the pressure in the pipe is too high. In this example, it will burst if the pressure exceeds 1400psi.
Based on the shape of the icons, we know that none of these signals are controlled from the PLC.
The large arrow to the left of the orange line indicates the drawing number (JR-ALL-POG-2-PID) you would reference to see where this portion of the process goes. There is also a “KO” indicator above the arrow, which tells you that the pipe is going to the Knockout (KO) pot, a different vessel in the process.
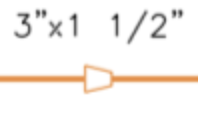
Finally, the polygons on the pipes indicate reducers with the sizes of the pipes indicated next to them. You will also see the S1150 and S31500 lines with arrows. This indicates the type of pipes connected here and are not relevant to process controls from an HMI perspective.

As mentioned on the previous slide there are colors used to indicate various process materials on the P&IDs. This is the legend for this project, with the colors used on the pipes at the facility, on the HMI screens, and the rough equivalents used on the P&IDs themselves.

Moving to the right with the PSV-CHPS from the previous image on the upper left, we will dig into the next portion of the drawing.
We can ignore the reducers and pipe size indicators like before. The arrows on the right tell you where to go for more detail on these portions of the process. In this case the orange line is taking off gases to the KO header, and the purple line is bringing hydrogen into the CHPS vessel.
Moving down to the purple pipe, note the following items:
FCV-2001: Flow Control Valve 2001. Since 2001 is the loop number, it’s easy to reference this valve elsewhere, and gives it a unique identifier in the system.
FE-2001: Flow Element 2001 is the sensor that is used to measure the flow in this pipe.
FT-2001: Flow Transmitter, a transmitter signal sent from the flow sensor back to the PLC.
FIC-2001: Flow Indicating Controller, this is the actual control loop that takes the flow reading and an operator’s setpoints, then changes the position of the valve to attempt to make the flow match the setpoint.
FALL-2001: Flow Alarm Low Low. This is an alarm in the PLC which indicates if the flow in the pipe drops below the alarm setpoint.
The green line between the FE-2001 block and FCV-2001 indicates that this element is connected to this valve and controls it. The squares around the FT, FIC, and FALL indicate these signals interact with or are generated by the PLC.
When we convert this P&ID to an HMI screen, the FCV/FE control loop will be greatly simplified by comparison. However, this drawing gives you all of the detail necessary to understand what is happening in this part of the process.
We can ignore the GV-2001, 2002, and CKP-2003, since they are manual items on the pipe and do not interact with the control system at all.
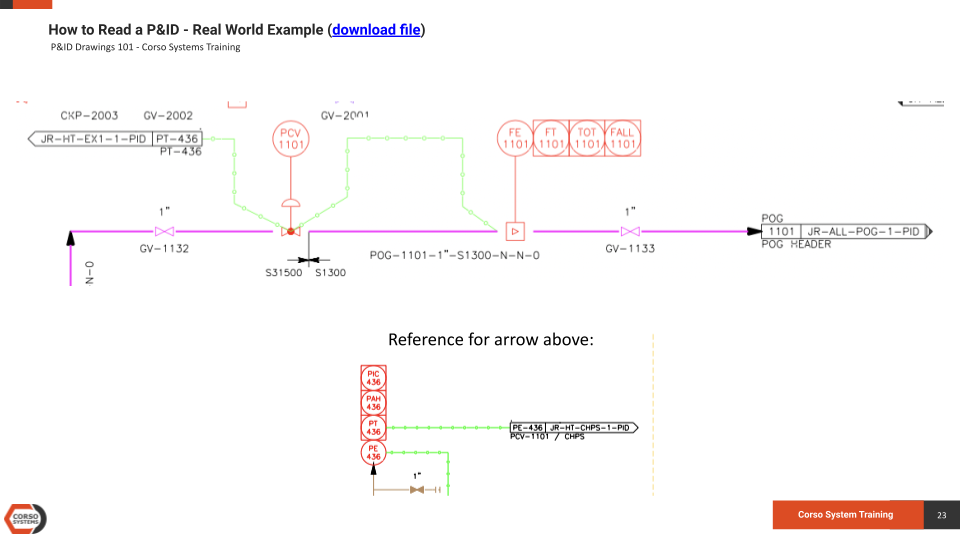
Moving down from the purple line to the pink line, we will examine the next control loop. First, note that PCV-1101 is a pressure control valve. The green line on the left goes to another drawing (JR-HT-EX1-1-PID) and connects to PT-436, a pressure transmitter. PLC-1101 also connects to the Flow Element block on the right.
This is more complicated than the previous examples, but this valve can control either flow or pressure. The function is selectable by the operator in the HMI, and is generally a non-standard use case for controls. In this post, we will ignore the other drawing, but you can go through the same exercise in understanding it by using the reference above if you like.
For the Flow section, we have FE-1101, FT-1101, TOT-1101, and FALL-1101. FE, FT, and FALL are the same as on the previous diagram. TOT stands for Totalizer and indicates that the PLC is totalizing the flow value through this sensor.
Similar to the last slide, the flow reading here (along with an operator setpoint) will control PCV-1101 to maintain a specified flow through this pipe.

Next, we will look at the blue lines to the right of the CHPS vessel. This diagram is very similar to the basic example from earlier in the post. Except this time we have two levels of instruments to give us redundancy in the system. These sensors measure the oil level in the vessel.
LI-CHPS is a physical sight glass on the vessel, connected to the top and bottom of the tank as indicated by the pipe connections going to the tank. You can ignore it for the HMI discussion, but from a physical perspective all of the level measurement devices could be closed off from the system using GV-5001 and GV-5005 which are manual valves. This would be useful for maintenance and cleaning purposes. Similarly, GV-5003 and GV-5007 will isolate LE-CHPSD. GV-5002 and GV-5004 along with GV-5006 and GV-5008 could be used to flush out the system.
To the left of LI-CHPS we have LE-CHPSC and LE-CHPSD which are instruments to measure the level in the tank. These both have associated LSH, LT, and LAL values, being Level Alarm High, Level Transmitter, and Level Alarm Low respectively. These all go to the PLC.
You will notice the green lines coming from these blocks. We will discuss those in the next diagram.

Orient yourself from the last diagram using GV-5007 on the upper left, we will trace where the green lines go next. In this case, they go to LIC-402 (Level Indicating Controller). This is a PID control loop in the PLC that will control some valves which are shown on other drawings. In this case, it will control LCV-402 and LCV-405. The particulars of those valves will be left out of this post, but the diagram would look similar to the valve/controller combinations shown on previous slides with LIC-402 connected to those valves with green lines.
Based on the control philosophy for this vessel, both sensors could be used as an average level, or the operator can select which sensor to use for PID control. This allows the operator to disable one if it has failed for example. Normally, you would not have multiple signals going to a single P&ID loop, so you would either select one or use an average value.
More detail is out for scope here, but for this example, LCV-402 is used when starting up the process, and LCV-405 is used when the process has reached a steady state. Normally, multiple devices would not be controlled from the same PID loop at the same time.

Finally we will dive into the last part of this P&ID example. We can ignore the maroon line on the upper left, since these are all manual valves going to a drain and would only be used for maintenance operations.
Moving to the LIC-3602 section, which measures the water level in the tank after it has been separated from the oil, you’ll notice a similar setup to LIC-402 on the previous diagram where we have redundant level instruments. In the case of this diagram, LE-CHPSA and LE-CHPSB (along with the associated High and Low Alarms, and Level Transmitter LIC-3602) connect to LCV-3602. This allows the valve to be controlled based on either LT-CHPSA, LT-CHPSB, or the average of both.
Moving to the black line, you will see a flow element and an associated low level alarm. Similar to the KO diagram earlier, a reducing orifice (RO) in the pipe after LCV-3602.
One item to note on this drawing is the bypass loop at the bottom. This 1 ½” manual valve is normally closed, which forces the water to flow through LCV-3602. For maintenance purposes it is possible to close GV-3601 and GV-3602, then open this 1 ½” valve to remove LCV-3602 and the pipes connected to it from operation. The output of the these pipes then goes to the PW (Process Water) Tank. And that wraps up this P&ID analysis!
Ready to learn more? Check out P&ID Drawings 301.