Map Your Process Using Ignition
On Inductive Automation’s recent “Design Like a Pro: Industry Specific HMIs” webinar, we shared our map-based SCADA implementation that we typically use in large manufacturing facilities.
Adding a map-based interface to a manufacturing process’ technology stack has many benefits, as we discuss in this post.

One SCADA System, Many Audiences
When connecting manufacturing process data to your entire enterprise, it’s critical to make sure people have access to the information they need—when and where they need it.
Typical SCADA system designs are not well suited for conveying large amounts of information to many different audiences. While operators who use the system daily can parse a lot of information, someone from company leadership (who isn’t an expert in every nuance of the system) may feel lost when looking at an overview screen.
We can alleviate these issues with a Map-Based SCADA approach.
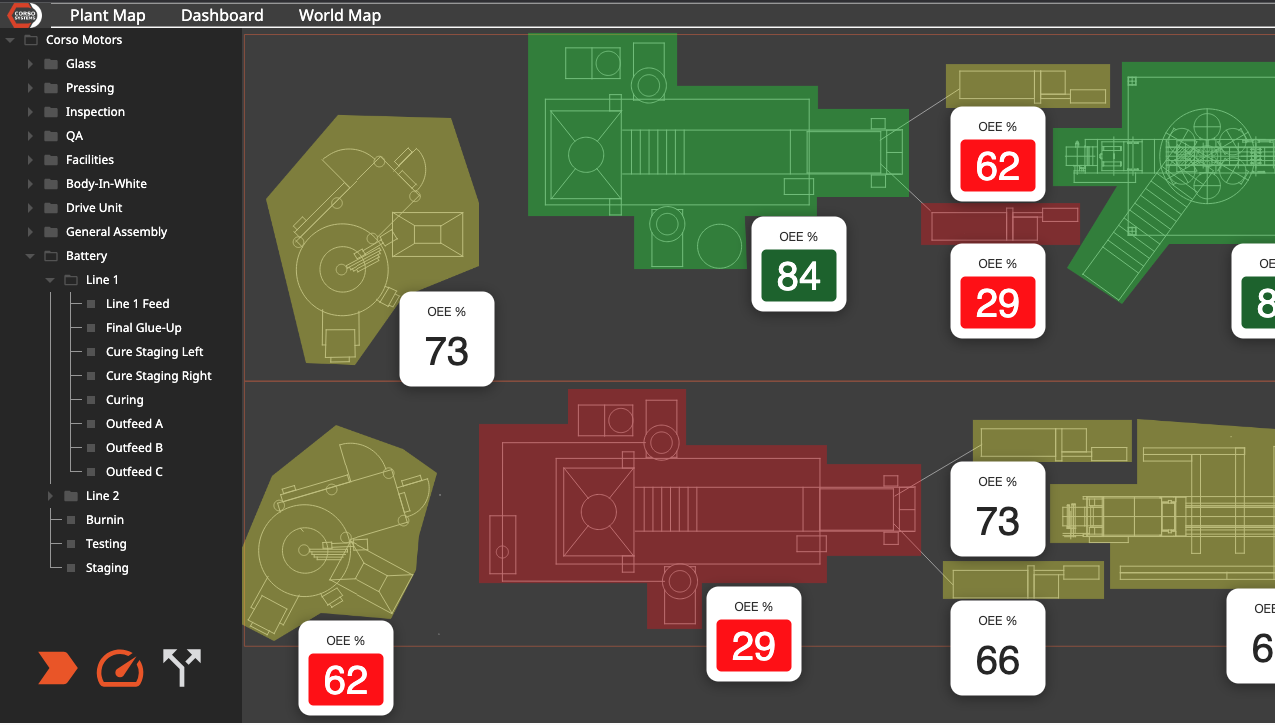
On a map of the plant floor, we can easily display equipment status, any number of relevant KPIs—along with the flow of material through the process, alarms, and complex data analysis—all in the same interface. All this data can appear on a plant map, so you can quickly understand what you're seeing by looking at the equipment on the floor.
Now, instead of needing to engage the controls team to build a new screen, all of the relevant information will be available to any user of the system. If a user needs more information than what they see on the map overview, they can drill down to what they need, click by click.
Simplify Access to Information
Simplify access to any information in your process with a map of the plant floor. Starting with a foundation of equipment outlines, we can add layers to access any information in your process.
We can add any template, KPI, chart, report, or display you use in your process to the map using the tags and data you already have in Ignition.
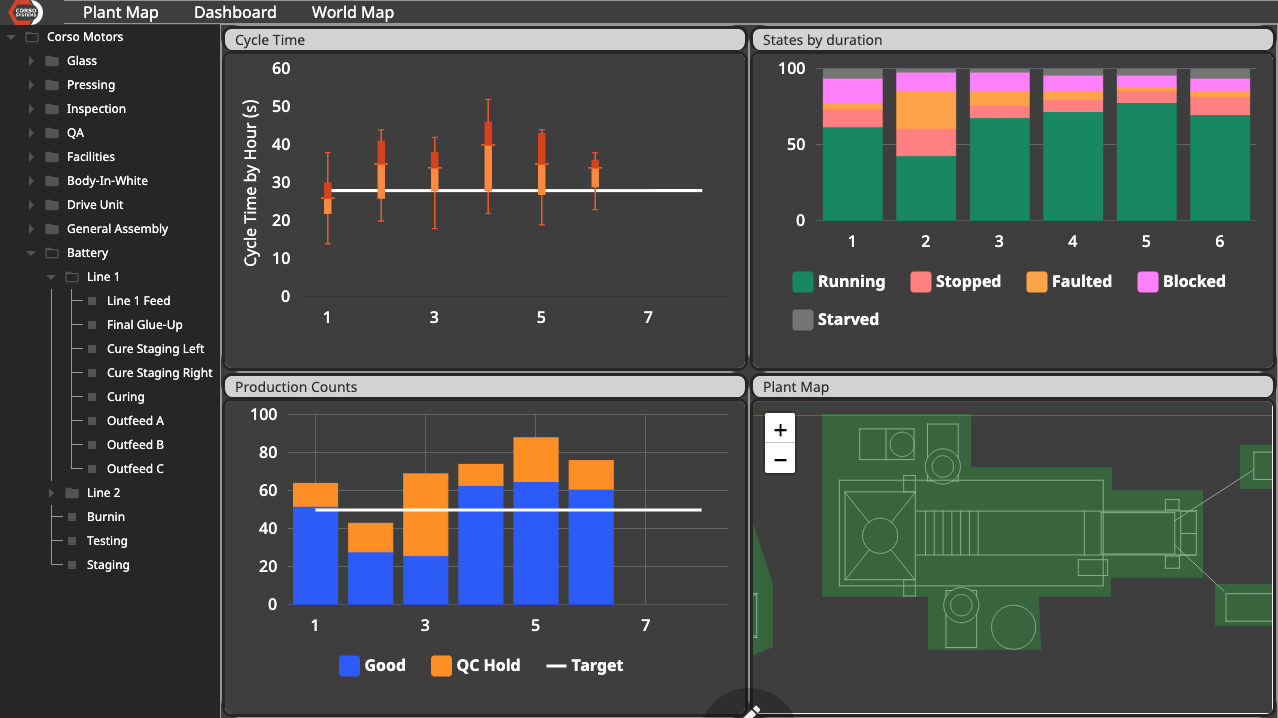
Using the map’s dataset, you already know where each piece of equipment is located in the facility. Essentially, adding graphics to the equipment is already done for you. You simply need to decide which information you want to display, then set it up in a layer for your users to access on demand. In the image above this section, you can see the dashboard with the polygon layers enabled. This is also indicated by the icons on the bottom left of the screen. Also note that the process flow diagram is disabled. (You can see the process flow diagram indicated with blue arrows in the first image on this post.)
Users can quickly find information that’s relevant to them (and their decision making process) as well as hide any distracting info they don’t need with this layered approach. Similarly, they can save their own configurations so that they can customize their own displays and view them again at any point in the future.
With the tree-based navigation on the left, plus the ability to zoom and pan on the map with a mouse or tablet, users can view and navigate to any part of the facility with minimal effort.
Drilling Down Into the Details
Beyond the map overview, you can also drill down for many levels of detail at any location, piece of equipment, or process area.
Similar to the graphic layers on the map, any piece of equipment or part of your process can have a dashboard template, and get integrated with with the map.
In the example above, we’re showing a dashboard for a specific location in the plant. The dashboard includes a view of the map with OEE status polygons, a box and whisker chart for cycle time, overall machine status by hour, and production counts by hour.
All of this data can be shown for any equipment in the plant by clicking on it in the map. Or, view the aggregated data for each production line and process area by selecting the desired area in the tree.
Wrapping Up
A Map-Based SCADA system is a very powerful tool in the Ignition ecosystem. With the Ignition Perspective Module, you can access the same interface across all devices, including mobile devices.
Because your team is already familiar with map apps on their phones for navigating around town, they will now be able to use this familiar interface focused on your plant. A Map-Based SCADA system will give them access to all the data they need to make decisions—even at critical operational moments. Developing this interface also requires a lot less effort from your SCADA and controls teams.
If you would like to see a more in depth demo of our Map-Based SCADA capabilities, please watch the recently recorded Webinar from Inductive Automation featuring our founder, Alex Marcy.
Do you need a map-based SCADA system at your facility?
Skip the line by scheduling a short intro call with Cody Johnson in sales today!