How to Increase Pre Roll Machine Efficiency
As the need for additional throughput in the cannabis industry grows, it is important for cannabis producers to implement automation and track production information in a more granular way to increase efficiency while reducing downtime and waste.
These concepts have permeated the food and beverage industry over the last decade. Now, in the cannabis industry is using more automation—including integrating individual OEM machines with the backend business systems, along with integrating production lines to better understand throughput.
Focusing on a common automated machine for pre-rolls, we will demonstrate a quick analysis for how to implement an Overall Equipment Effectiveness (OEE) tracking solution. We’ll also show how to make that data available for the business to understand production and find potential optimizations.
With OEE, we are assuming there is an existing business system integration or SCADA system in use for monitoring the production facility as a whole—or to at least collect data from machines so that it’s available away from the plant floor. Typically this will be software such as Ignition from Inductive Automation, a software platform that connects to PLCs and other plant floor devices, and makes the data available for use in other systems, allowing you to monitor and control your plant from anywhere.
If you need a review of OEE, we’ve included a walkthrough below. If you are already familiar, please skip to the next section.
OEE Foundations
We’ll review the definition of OEE and what data we need for calculating it.
At its core, OEE is defined by the ratios of availability, performance, and quality multiplied together.
Availability is the actual uptime of the machine divided by the total amount of time it could have been running.
Performance is the ratio of the actual cycle time of units produced with the ideal cycle time for those units.
Quality is the total number of saleable units produced divided by the total number of units produced.
Multiplying these together gives you Overall Equipment Effectiveness: OEE = A x P x Q
Availability
During a shift there will be times a machine is down. It might be scheduled to be offline, in which case we will generally ignore that as planned downtime. Availability concerns unplanned downtime.
Unplanned downtime is any time the machine is down when it should be running. Common causes are machines jamming, lack of product or packaging feeding the machine, or mechanical issues. A world class OEE system will use the PLC controlling the machine to detect any number of reasons the machine might be down, track when the downtime starts and stops. It will also generate a list of the reasons including duration and quantity to form a Top 5 or Top 10 Downtime Reasons report. From here you can dig into the reasons and find solutions. Maybe you need to do more maintenance, provide more training, or address product flow throughout the facility to make sure the machine has what it needs when it needs it.
Performance
In OEE, Performance is concerned with the cycle time of units produced. Your machine will have an ideal cycle time for a given unit produced, and how many you actually produced for a defined period of runtime. For numerous reasons, your machine might not produce units at the ideal cycle time. It may because of waiting on various steps to cycle through the machine, stoppages, or lack of material to name a few.
Performance is generally a little harder to measure, but many of the automated machines on the market have cycle time tracking built into their PLC programs, since OEE tracking has become more prevalent in the manufacturing industry.
Quality
Quality refers to how many good units you produced versus how many total units you produced. You may have produced 1,000 units in the time it should have taken you to make 800, but if 800 of them are not meeting spec, Quality will make sure that is apparent in the overall OEE metrics.
Depending on the process and the machine, you might be able to track quality in real-time, or you may need to send samples to the lab or inspection station before you can tell if the units are good or not. You can always update the quality data after the run and have it impact OEE once the data is available. It simply depends on your process and how you are validating products.
OEE in a Nutshell
To improve OEE you need to make sure the machine is online more during planned uptime, it is producing at the desired rate of speed, and your quality is solid. You can certainly produce faster, but if you don’t produce good product, you will find out very quickly with OEE. You can also produce good product quickly, but your machine might be down for a long time and have terrible OEE as well.
While each of the OEE metrics are independent measures, they rely on each other to give an OEE value. You need to work on improving each metric to improve OEE.
Pre Roll Machine OEE
Now that you’ve got a handle on OEE, let’s look at how this applies to a Pre Roll machine. We’ll assume this is a stand-alone machine and not part of an overall production line. In our example, an operator manually fills the product hopper, cones, and eventually removes the collection bin at the output of the machine as it fills up.
Availability
For availability, we need to first know if the machine is “always” on or if there is a production schedule. If there is a production schedule—for example if the machine only runs during the day shift Monday through Friday, we need to incorporate this in our production model. Any OEE system worth its salt will let you do this out of the box. The production schedule will affect the amount of planned production time for our availability calculations.
For the sake of this post, let’s assume we are running the machine and calculating OEE for a single shift, giving us 8 hours of planned production time. During that shift, we will have a number of downtime issues: some will be mechanical, some will be operator dependent, and we’ll hit the E-Stop a couple of times while we wait for some product to be delivered.
For our calculations we’ll also assume we have all of these reasons set up in the PLC, so we will get accurate downtime reasons with start and end times once the machine is in a given state. If we didn’t have these in the PLC, we could also build a catch-all screen the operator could use to select a reason for why the machine was down to make data analysis on the backend easier.
In the figure below we have tabulated the top five downtime reasons, how many times they occurred, and the total duration of downtime attributed to each reason. Now, we can calculate the overall availability for this shift and come up with 84.69% for our Availability score.

As you can infer from the list in the table above, we have had some issues getting product to the machine. This is likely a training issue we need to address with the operators. We also need to monitor and get more product sent over before it runs out. The fill tube jam is likely a mechanical issue. If we are using flower on the machine instead of shake, we might need to bump up our cleaning frequency on the tubes. The E-Stop would require some discussion with the operators to learn why they pressed it.
The Cone Feed Jam issues might be mechanical, but they could also be a training issue requiring training the operators on how to properly load the cone feeder. Low air pressure downtime might be related to settings on the air line, or maybe a maintenance issue if something is causing a problem in the air lines.
Some reasons may have obvious solutions, or you might need to use this list to dig deeper to uncover the causes and how to fix them. Either way, once you are measuring the reasons, you can easily understand the direct impact downtime has on your process and overall throughput, then you can start to improve your uptime.
Performance
Performance is a little easier to calculate, assuming we can measure it easily. For a Pre Roll machine, it is pretty easy to calculate how many units we have produced, and based on the machine capabilities and recipe configuration we know what we can produce during any given period of time.
For this shift we ended up producing 17,764 pre rolls, during the period of time from the Availability calculation of 406.5 minutes. Based on this recipe, we could theoretically produce 3,000 pre rolls per hour, giving us an ideal cycle time of 1.2 seconds per pre roll. Doing the math, we have a Performance score of 87.4%

Quality
As we know from the performance calculation, our example machine made 17,764 pre rolls during our shift.
The operator found some defects during an initial visual inspection. Some were split cones, some separated filters, and a couple were empty rolls. Spot checking weight on a few units per hour also found that during the 4th hour of the shift, the machine was under-filling one of the tubes 2% outside of the spec. This was resolved after it was verified as an issue, and after further investigation contributed to one of the E-Stop events. So, only a dozen or so pre rolls were lost.
In the table below, you can see the breakdown and quantity of each quality issue, giving us an overall quality score of 98.55%

OEE For the Shift
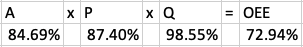
Based on our scores above, we have Availability of 84.69%, Performance of 87.4% and Quality of 98.55%. Multiplying these all together gives us an Overall Equipment Effectiveness (OEE) score of 72.94%
Using OEE as a Change Agent
As you can see with our example, you need to know and work with this data as a foundation for impacting on your operation. Our overall Availability has some items we can address by adjusting our standard operating procedures and doing some training. Performance is relatively good, but we would need to look at the cycle time over the shift to find trends there.
Once we track cycle time on a chart, we could dig into other machine parameters to understand where the slowdowns occur. It could be issues with the machine, operators, or even that the ideal cycle time itself needs to be adjusted to account for real-world conditions. Our Quality score indicates that we may need to talk with our cones supplier of cones, and observe how the operator is handling them going into the machine. If we find any torn cones or separated filters before they are filled, it would help our numbers, or determine if there is something inside the machine causing problems.
72.94% is a good OEE number. World class is considered to be at least 85%, so we are doing pretty well. Of course there’s always room for improvement. Having OEE as a key performance indicator you can track over time now allows you to get a sense of your operation. You can even begin to compare the OEE of different operators and different shifts. This can help you track down training issues.
Once you have a larger dataset and integration with more systems like your lab, suppliers, and even the plants coming from the grow room, you can start to find commonalities amongst the issues you experience and start to nip them in the bud before they make it all the way through production.
Corso Systems can track OEE on any equipment, and help you integrate your entire facility into a more user friendly and capable system. Use the button below to visit our Contact page and reach out to see how we can help you today!