Data Beyond SCADA and MES

SCADA systems have been around for a long time. They are really good at controlling processes and collecting time series data. Using a SCADA system, you can easily build trends for any time period and get an accurate picture of how the process was operating.
Manufacturing Execution Systems (MES) have been around for less time, yet are a very important piece of making a manufacturing operation more efficient. Tracking Overall Equipment Effectiveness (OEE) is usually the first step in an MES integration. OEE helps you understand how downtime, throughput, and quality issues impact your bottom line. Beyond OEE, you can move into areas like Statistical Process Control (SPC) to get a better handle on your quality. Next might be Computerized Maintenance Management Systems (CMMS) to get downtime and throughput under control. Finally, training can help your operators understand how to operate the equipment. Additionally, Recipe Management can help standardize setpoints.
Beyond these common tools, the next steps dependent on your needs. Warehouse Management might be the next low hanging fruit: integration with shipping/receiving, scheduling, or supply chain management with Track and Trace might be useful.
Another option to more integrations, is to leverage new tools from the past few years and technology to better analyze the data you’ve already collected. This is kind of like finding huge mountains of tailings in an old mining town. The mining operation couldn’t extract 100% of the metals from their ore, so they did what they could, then as technology improves, they can go back through the tailings and extract more value from them. This is roughly similar to what you can do with data using new technology.
Dashboards & Andon Screens
The concept of Andon screens come from Lean Manufacturing—most notably from the world of Toyota. Andon means “lantern” in Japanese. Andon screens “shine light on your process.” In other words, Andon screens are synonymous with plant floor dashboards. Typically, Andon screens are TVs mounted near production lines or in common areas. Everyone in the plant can see how production is doing at any given time.
Andon screens can also incite a bit of beneficial competition among operators. Different shifts on the same line may try to out perform each other in terms of overall production. Or, different lines may try to meet their production goals first.
There are a number of different approaches and technologies you can use to put Andon screens on the plant floor. In this section, we’ll highlight a few common ones in the next paragraphs. Note: it will usually require a company-wide cultural shift before Andon screen deployment will have an impact on the bottom line. This is also true of any process optimization approach, MES integration, or sometimes even automation itself!
Ignition (or other SCADA platforms)
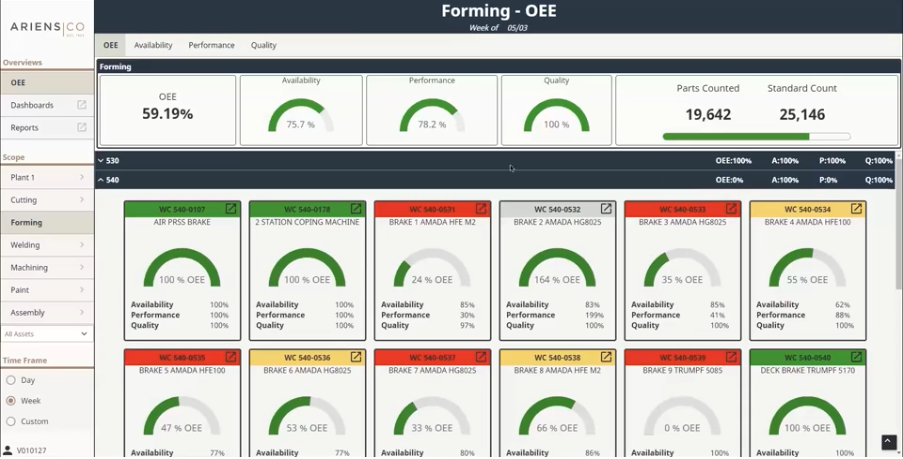
Arguably the easiest way to get a dashboard on a screen is to create one in your existing SCADA platform. Ignition is great for this purpose, as there are no additional license costs involved when creating a new screen. You simply build what you want to see, install a TV and get a signal to it. This is even easier in the age of Smart TVs and the Ignition Perspective module. Typically, we will set up a dashboard in Perspective, configure the TV to go that URL on startup—while passing in any URL parameters to pull up the correct line—and everything works out of the box.
This approach only requires you to have access to the data in Ignition and build out a few screens. Another benefit to this approach is that the same screens can be reused for folks accessing the dashboards at their desk or on mobile devices.
One big benefit of using a SCADA platform is that it will display just about any data you want. You won’t be limited to only OEE (which is an issue with some of the other Andon options).
Vorne
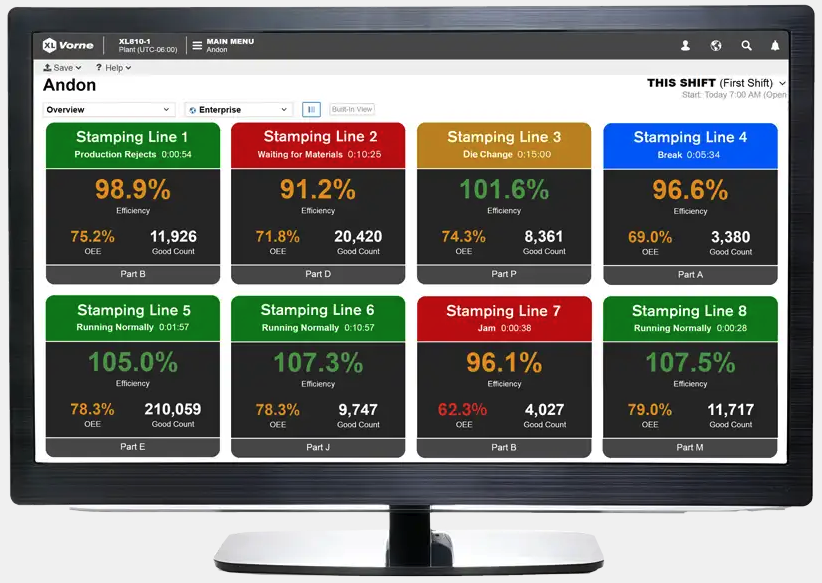
Back in the late 2000s when OEE first started gaining popularity across the manufacturing world, Vorne was one of the first major players in the plant floor display scene. They started out with LED displays and have since built out a web-based system to keep up with industry trends.
The beauty of Vorne is a minimal integration requirement to start getting OEE data onto the plant floor. This is true of most OEE focused systems. They handle a lot of the heavy lifting for you on the backend with pre-configured components and screens which can reduce development time.
The hurdle with Vorne (or any other OEE-focused platform) is that getting data beyond OEE onto screens can require some additional development time and resources.
Redzone
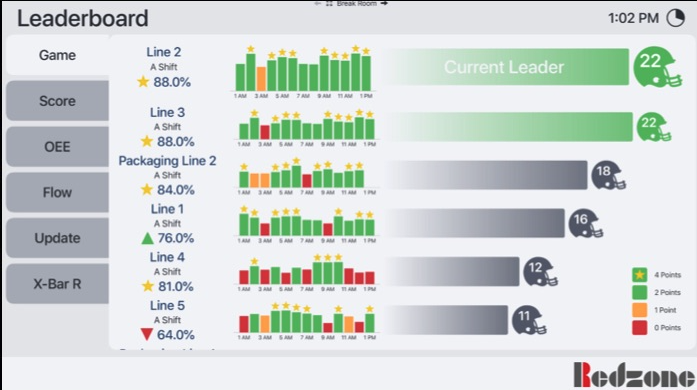
Another frequently mentioned system is Redzone. Similar to Vorne, Redzone is focused on OEE. It requires minimal integration to get started, and is designed for plant floor display. The other unique benefit of Redzone is the option to work with their team to push the culture shift. Redzone’s team uses huddles to understand the process and takes an agile approach to production(similar to using agile software development practices).
Redzone’s limitation is that it’s basically a black box and very limited in terms of future customization and development. You generally need to rely on their team to do the integration and implementation. Using Redzone also means you will be heavily adopting a American football motif. It is always interesting to walk into a food and beverage facility and see color coded football helmet icons on the dashboards indicating how the system is running!
Data Analysis Tools
If you have process engineers on staff, team members familiar with Six Sigma, or simply want to dig deeper into the cause and effect of how your system operates, then you will likely want to use more powerful data analysis tools than those included with your SCADA platform. SCADA is great for real time data on trends, yet without a significant development effort, it can struggle to provide deeper data analysis. Luckily, over the last few years a number of very powerful tools have come to the market.
Seeq
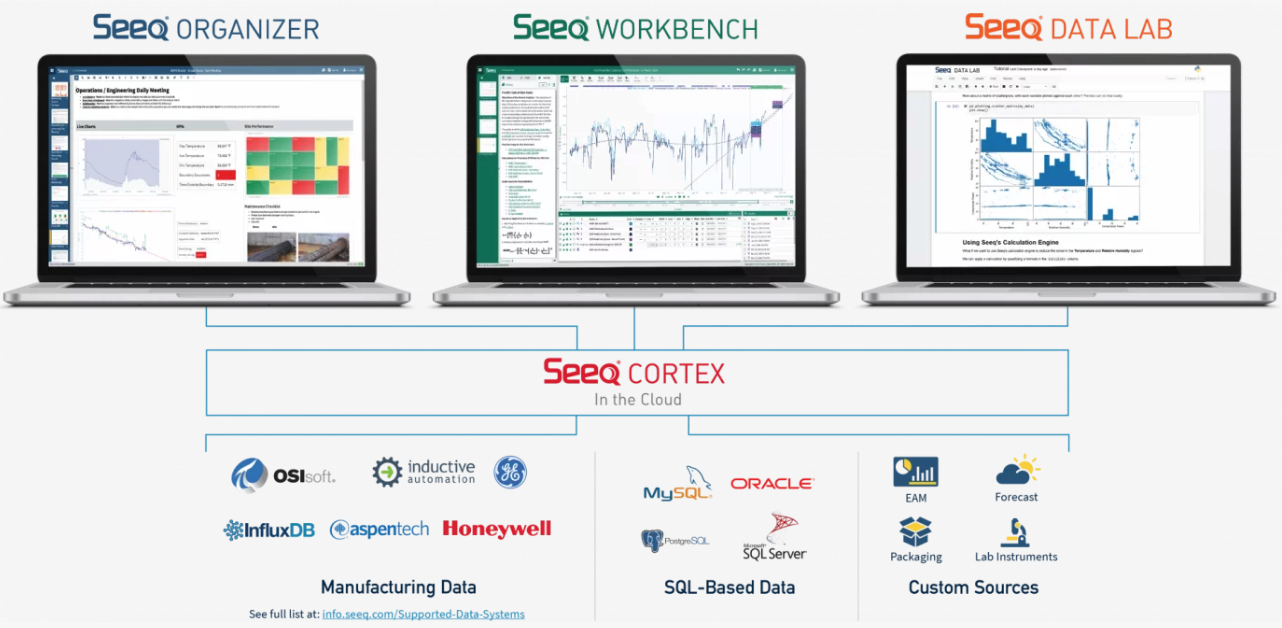
Seeq is one of the most popular data analysis platforms. It is a suite of powerful tools for getting insight into your data quickly without having to do a lot of additional development. While you have the option of getting into the nitty gritty details, you aren’t required to before seeing results.
Seeq has three major tools:
Organizer
Workbench
Data Lab
Organizer generates reports and web-based views on your system. Technically, you might even use this for an Andon screen! Workbench is similar to a process data focused Excel tool. You can use it to analyze your data, apply pattern recognition tools for some easy machine learning functionality, do calculations, and build out advanced visualizations.
Data Lab is probably the easiest way to get process data working with Machine Learning algorithms as it gives you a fully functional Python environment with Jupyter Notebooks. If Workbench is like Excel, Data Lab gives your team an entire data development platform. Seeq allows you connect just about any data source, and is a bridge between the world of SCADA and Industry 4.0/Data Lakes without committing to that level of infrastructure up front.
Seeq has also partnered with the analytics visualization company Tableau to leverage their industry-leading visualization capabilities with the power of Seeq’s calculation engines. This approach gives you the best of both worlds.
In the manufacturing world, Seeq is a great tool geared to help solve the problems most manufacturing companies face with data analysis. It simplifies some of the hard things, and gives you a lot of value without having to be a full-fledged data analyst to get started.
Tableau
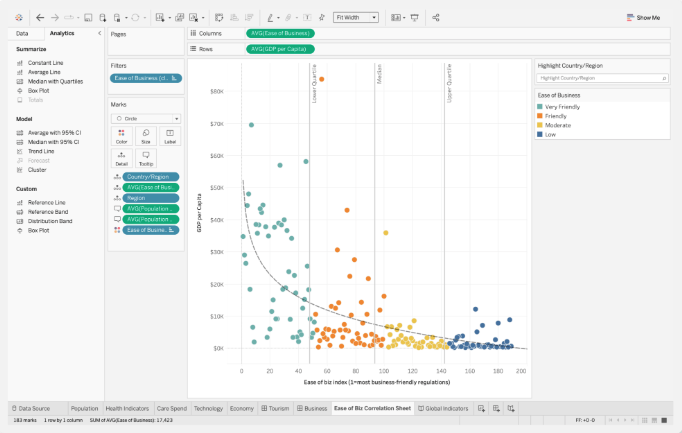
If you are using Seeq, you can also get easy integration with Tableau, although you can also use either one independently.
Tableau is a very popular and powerful visualization platform. When companies are operating at a large scale, they commonly use something like Ignition for their HMI/plant floor operations then dump all of their data into a database and visualize it using Tableau. This approach allows you to make intuitive trends, graphs, and reports, along with powerful analytics and calculation capabilities.
While a tool like Seeq is very focused on manufacturing, Tableau is used by many of the leading companies in the world, not just in manufacturing. It can be a very powerful tool, but it also needs people who are well versed in it to get the most value out of it.
Tableau is one of the most powerful analytics platforms on the market, and can give data analysts a lot of insight into anything they might be interested in. While it can be a little overwhelming if you are new to analytics, you won’t find yourself outgrowing it anytime soon.
Power BI
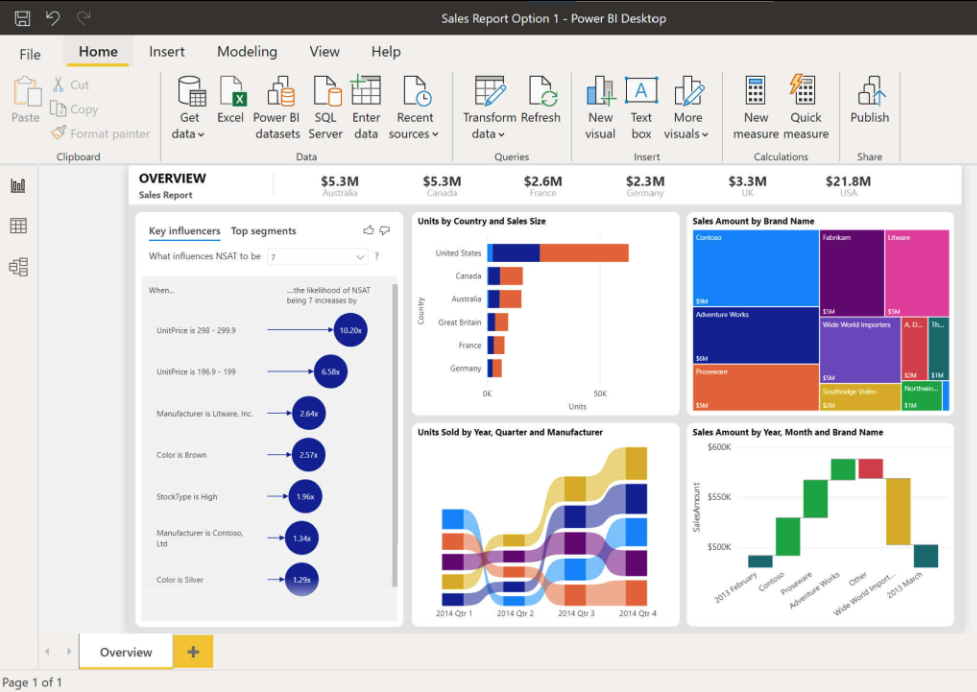
Power BI is similar to Tableau, however it is powered by Microsoft. It’s most useful for folks familiar with the Microsoft tech stack, or who might be using Azure as a cloud platform. In the industry, it is somewhat considered to be an entry level analytics platform. While it is a great way to get started, you might running into limits as compared to options like Seeq or Tableau.
It has been described as the second coming of Microsoft Access. You can do more with Power BI than you can with Excel, but it isn’t going to provide the full capability of developing something in house using more advanced technology.
Power BI is a great tool if you already have access to it either via a Microsoft agreement, or because you are using Azure. If you are just getting started with analytics you won’t outgrow it anytime soon, and it will teach you how to think like a process engineer when interacting with your data.
Machine Learning
Any discussion about advanced data analysis tools must include machine learning.
While getting into the details would require a series of posts, there are a number of ways machine learning can be deployed in manufacturing. Most SCADA platforms don’t have access to the right technology stacks to integrate directly with machine learning platforms like TensorFlow, so you will need to set them up with access to your data to begin generating and training models.
Examples of using machine learning in manufacturing:
Optimize utility usage by understanding how/when equipment startup interacts with peak demand pricing and can be adjusted to meet production demands while saving money.
Monitor process equipment including things like vibration monitoring, runtime, and alarms to predict maintenance requirements before equipment failure occurs.
Reduce inventory levels and waste by applying machine learning algorithms to customer orders/shipping and receiving to enable a more “just in time” manufacturing approach.
Wrapping Up
Any of the topics in this post could be a big focus of someone’s career. Corso Systems has worked with all of these tools before, and we’ve seen how to avoid the pitfalls of diving into the wrong platforms. Leveraging technology to give people access to more information—when and where they need it—can have a powerful impact on your workforce and overall productivity.
These are simply some of the options to empower your workforce beyond the most common SCADA tools in use at most manufacturing facilities.
If you have questions about any of the things we talked about here, or any other platforms you might be looking at, reach out and let us know!
Get Data Far Beyond SCADA and MES
Schedule a short intro call with Cody Johnson in sales today to discuss your company’s needs.
Or contact us with your project details and requirements to get started right away.