P&ID Drawings 301: Creating SCADA and HMI Screens From a P&ID
Hopefully you’ve had the opportunity to read through the first two posts in our P&ID Drawings series. P&ID 101 reviewed the basics of a P&ID Drawing and how to interpret the various lines and symbols. P&ID 201 taught you how to understand a P&ID along with a control philosophy for describing how the process operates—and how to build a mental model of everything working together. Now, in this third post of this series, we will combine the concepts to show you how to build SCADA screens and HMI from a P&ID and Control Philosophy.

The above image is a relevant section of an HMI screen. Obviously, you will see more devices and equipment on this image than on the P&IDs we covered in earlier posts.
As we examine the detailed views of this drawing, the relevant devices/signals will be highlighted on the drawing and the HMI graphic, anything irrelevant to the demonstration will be grayed out.
Real-World Example: Turning a P&ID Into an HMI Screen

As you create an HMI screen from P&IDs, you will likely need to be creative with the layout so that the operators have the information they need, where they need it. To work within screen size requirements, this could mean that you will display items in multiple places, or duplicated on multiple screens, or that information is displayed differently than on the P&ID.
On the HMI screen (the lower half of the diagram above) all of the valves are templates with associated parameters. The specifics of the templates aren’t important for this discussion, as those will be project specific. You will also notice that the pipe colors match the P&ID, and when the pipe reaches the edge of the screen, there will usually be an arrow indicating where it is going. In this particular project, arrows are also used for navigation to take the operator to other relevant screens. Notice that the arrows on the P&ID are pointed in an opposite direction than those on the HMI. This is okay. You can generally structure the screen layout so that it makes the most sense to the operators, even if it doesn’t match the direction of the original drawing. Usually, the diagrams will flow from left to right and from top to bottom on the screen.
Many times a P&ID detail like this example sheet above will be part of a larger diagram which will show the entire process. So, the directions on the detail are a remnant from the larger drawing.
Based on their symbols, SOV-EDP and PSV-CHPS would not typically be shown on the screen since they are not going to a PLC. But, in this particular case the customer wanted to show them on the screen to help operators in the event of a problem. By including the devices, the operators will know that the devices exist, and that they need to be checked if something unusual happens in this part of the process.
“The customer wants it on the screen” is usually a valid reason to put something on the screen. Even if it isn’t 100% correct when according to the P&ID in terms of PLC signals. There are other reasons to show symbols which can be useful in different situations.

In this section of the diagram, you will see FCV-2001, a reading for the flow sensor, arrows, and a line connecting the flow reading template to the valve it is controlling. Technically, the FCV-2001 should have a position signal with a square around it—as that command will be coming from the PLC to control the valve actuator which opens/closes the valve. But in this case, the standards were not followed 100%. This is a common occurrence, and you will likely make revisions to your screens once the customer sees them.
On the screen example above, you will also notice that the valve itself has a Manual SP field, while the flow reading has an Auto SP field. These are relevant to the PID control of the valve. The manual setpoint will directly control the position of the valve. The Auto SP will modulate the valve in an attempt to keep FT-2001’s value matching the setpoint entered here.
You will notice we chose to call out FT-2001 as the device out of those four signals. This is because every transmitter is considered to have a sensor/element by default, and the sensor/element is not the signal that interacts with the PLC. The signal comes from the transmitter. The Auto SP, and the auto position command to the valve come from the FIC, so we are using those values even though the FIC isn’t specifically called out on the screen. FALL-2001 is configured on the tag, and isn’t specifically called out on the screen as it will show up in the alarm screen.
We also see a green dashed line connecting FT-2001 to FCV-2001. This is there to indicate this flow transmitter is used to operate the control loop for this valve and is there for operator understanding. It isn’t critical to the screen and many companies leave things like this off their screens. We like to include it where applicable to make the process control system a little easier to parse out when looking at the screen.
For reference, the arrows are also highlighted on the right side of the image.

On the screen above, notice PCV-1101 and FT-1101, along with the manual setpoint for the valve. In this case, the Auto SP is not part of the FT template, it is above it, a decision based on the templates built for this project. Notice green line indicating PT-436 operates PCV-1101.
When building the project and commissioning it, we determined that we would only use pressure control for this valve—not flow—so in this case, the screen looks slightly different than the P&ID. Again, this is very common in real world projects. If the valve were controlled by the flow transmitter we would connect the valve to that with the green line, and the valve would likely be called FCV-1001 instead.
It is also possible to set valves like this up to be controlled in flow or pressure mode depending on the process. If that were the case we would set up a green line indicating the selected control mode and transmitter. In this scenario the valve would usually be called PCV or FCV the entire time regardless of the selected control mode, only the controlling signal would change.
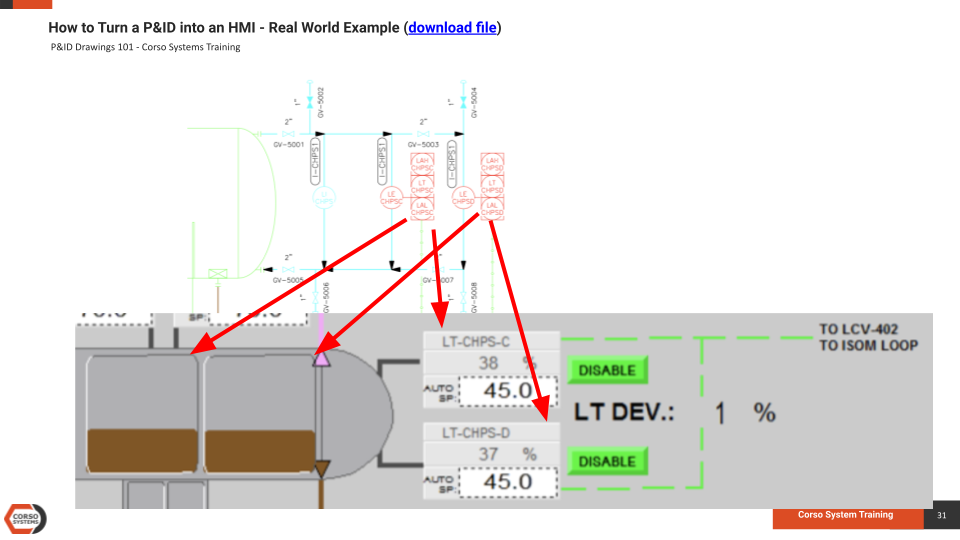
On the image above, notice the similar template for the level indicators to the right of the vessel—and a graphical representation inside the tank for both LT-CHPS-C and LT-CHPS-D.
The green line indicates that lines are going to actuate LCV-402, which is used for starting up the process.
You’ll also notice that an LT Deviation (LT DEV) calculation is displayed. This isn’t shown on the P&ID itself, and it isn’t critical for operation so doesn’t need to be included there.
You will also see the DISABLE buttons for each sensor. The operator can click a button to take it’s sensor out of service, out of the calculations, and out of the control loops which are based on those values.
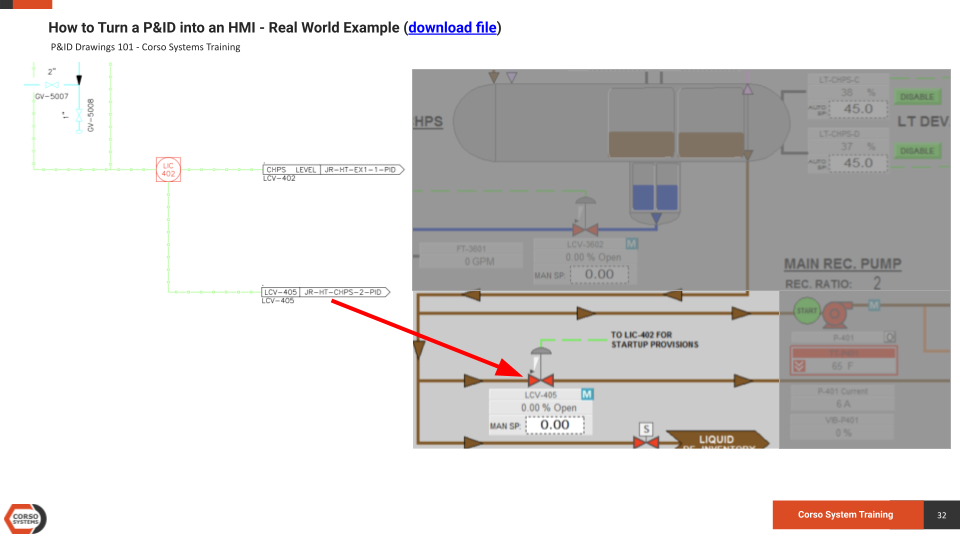
The image above is a decent example of when the layout of a P&ID might not be 100% replicated on an HMI screen. Notice that here, LCV is shown below the CHPS vessel. This layout is helpful because it allows the operators to see everything on one screen.

Similar to the previous example, in the image above, we have an LT template for LT-CHPS-A and LT-CHPS-B along with a graphical representation for each. Based on the process colors, this will be is indicated by blue instead of brown for the oil. You will also see the control valve and flow transmitter below the CHPS tank on the screen.
HMI Rules of Thumb:
Give the customer what they want, even if it isn’t 100% “correct”
Screen layouts will generally flow from top to bottom, and left to right
Ask about colors BEFORE you start (green/red => start/stop or stop/start?)
Figure out the alarm scheme with the customer BEFORE you start
Align objects with each other so that they look organized
Keep signals and the devices they control close to each other whenever possible
Indicate the process value controls with their device using a line in a contrasting color to connect them
When crossing pipes at right angles, place a curve in the vertical pipe which passes over the horizontal pipe to indicate that they are not connected
Use directional arrows on pipes to show flow direction. Make the arrows the same color as the pipes with an outline
Generally, you should be able to move to and from any screen to another within a maximum of two clicks
Use the alignment tools
Disable (or gray elements out) when possible to indicate that they are not in a mode for operator interaction—unless the customer requests otherwise
Avoid drawing swastikas or other offensive symbols with pipes
Pick consistent fonts, sizes, and styles to use throughout the project
USE THE ALIGNMENT TOOLS
The Special Corso Systems’ Super Secret HMI Design Rule:
Even if you could take the final screen design after all the revisions are made, go back in time and implement that the first time…someone is going to want to put their stamp on the screen and would request a change. Even when you get really good at screen design be sure to leave a couple things slightly mis-aligned, use a different font, or get in instrument number wrong during the review process. Basically give yourself a few easy things to fix to draw people’s attention to those so you don’t get bogged down in things that are more difficult to change when someone inevitably wants to put their stamp on the screen. Do right by yourself and your users and build a good screen to start, simply leave some easy wins for the review process.
Wrapping Up
We hope you enjoyed a run through our P&ID style screen development training process! It is important information for people to learn. It doesn’t require you to take a senior level Process Engineering class in a Chemical Engineering program to understand how to look at a process and a P&ID to see how they relate.
If you would like to see any of our other training materials set out into the world, please reach out and let us know!