Getting Started with Opto22 groov View
Did you know that each Opto22 groov EPIC PLC comes with free, built-in web-based HMI software? You can even use groov View on mobile devices with no extra configuration. It has a dedicated mobile app, AND it will send notifications! Opto22’s groov View also has automatic tag history built-in. The groov EPIC PLC, an HDMI cable, and a touchscreen monitor (or monitor with keyboard/mouse) can replace a panel PC and an Ignition Edge License. This setup has a lot of flexibility for any use case.
It would be really interesting if you could use a link from the groov EPIC software and navigate to an Ignition Perspective view on the built-in HDMI display—but at least as of the time of this writing you can’t leave the groov View server in its local displays. But, that feature would save a huge amount of cost and supply chain headache—plus you would not need a panel PC to tie into an existing Ignition system.
How to Access groov View
To get into the groov View interface, connect to your groov EPIC controller, login to groov Manage, and click the groov View button. If this is the first time you’ve accessed View, you can set up a new page. Read the groov View user’s manual for more information on setting up a new page.

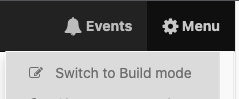
For our example, the page is set to load in View mode. To access Build mode, click the menu in the upper left:
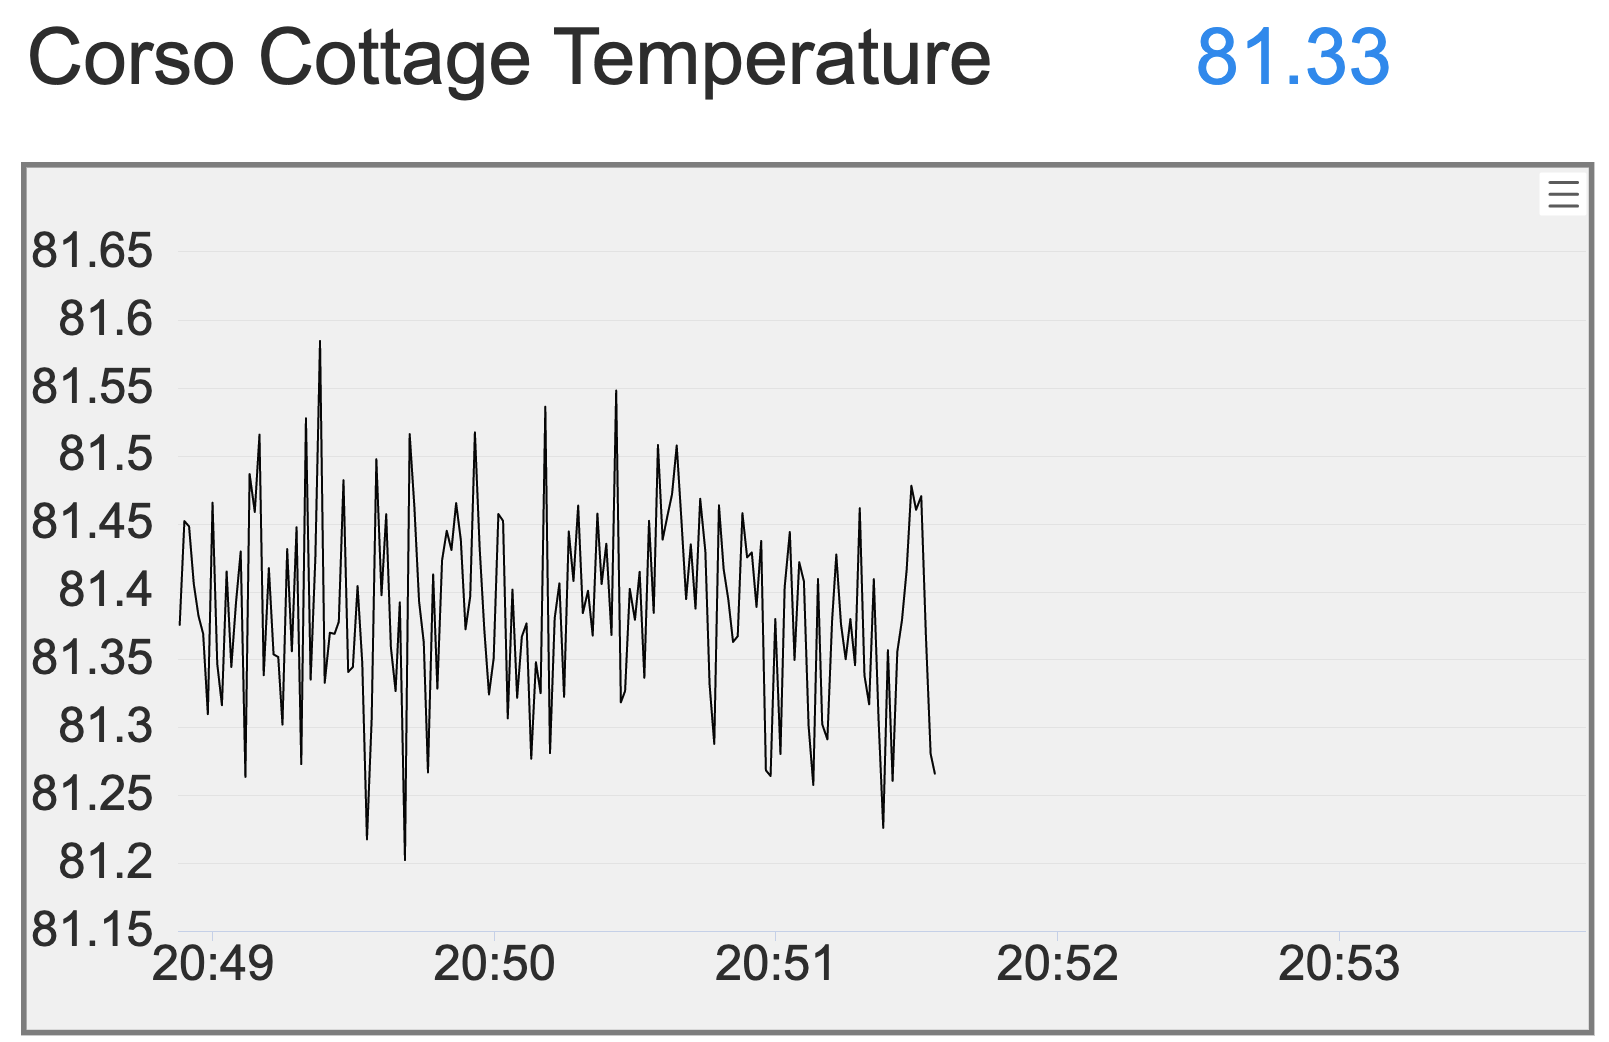
Once in build mode, we can look at our Tags in the bottom right. We have a groov EPIC learning center set up at our Chicago location, and the thermocouple input measures the room temperature. Since no one is there right now, the AC is off and we can see that it’s a little toasty in there!
The image below is displaying the I/O modules and the tags we have configured on each channel. In our example, channel 0 is on the thermocouple card.
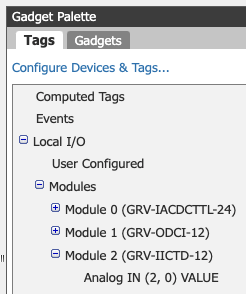
The groov View build mode tag tree
Click the “Gadgets” tab to see all the items we can add to the screen.
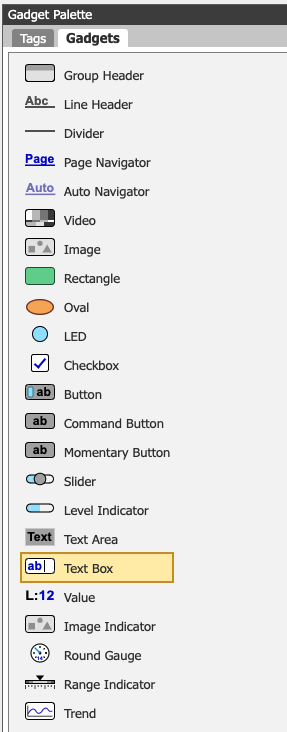
The groov View gadget tree
Building an HMI Dashboard Screen
For this post, we will set up a quick dashboard screen to monitor the temperature with a text display and a trend.
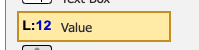
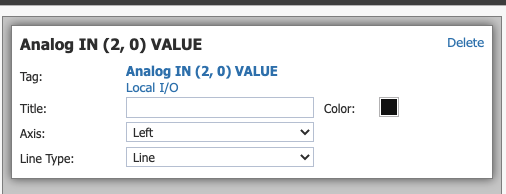
To configure this, first click on the Value in the gadget tree and drag it over to the window itself in the middle of the screen.
Click the value component on the screen, and its properties will appear in the upper right corner. Here you will want to change the Label property to describe what you are displaying. Then select the tag by clicking on the Datasource field and selecting the tag you want to display.
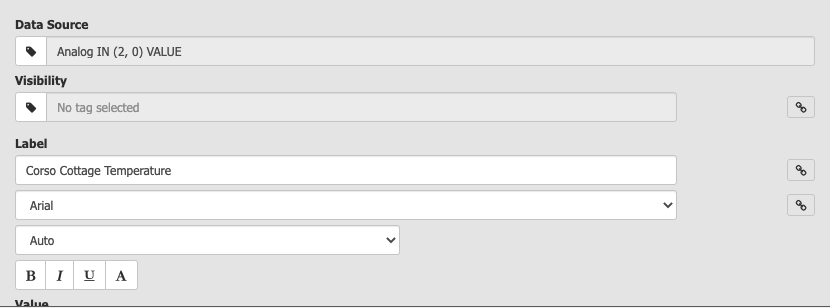
Once you update these values on the properties screen, you will see the label update on the screen pane, and a numeric value displayed where the number will show up. *Note, the values won’t update in real-time until you go into View mode.

Next, we will add a trend to the dashboard. Go back to the gadget panel, and click and drag the Trend gadget to the screen.
Click on the trend to configure its properties.
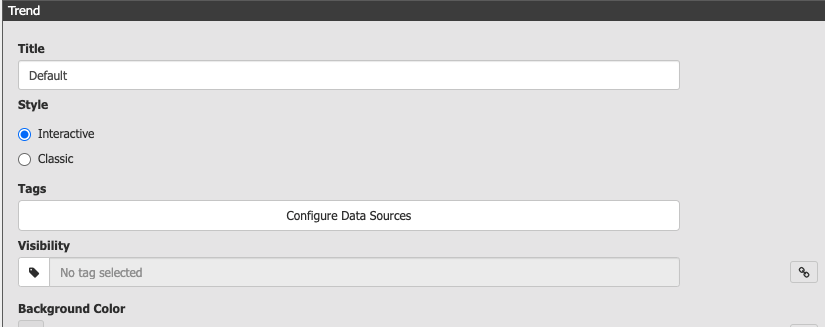
You will most likely want to update the Title property, too. The Interactive setting for trend will give you a real-time chart with up to seven days of history, and Classic will give you a chart you can use with up to 5 years of history. The history is automatically set up for you when you add the pens to the chart.
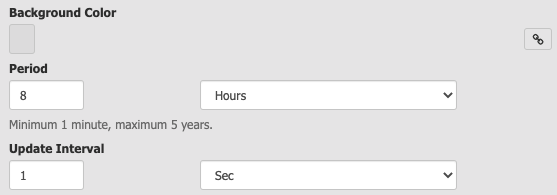
Click “Configure Data Sources” to select the tags (up to four per trend) and then update the interval time on the Period. Next, update Interval to control how much data is shown on the trend.
Now you will see a trend with the title you selected and a static graphic with the time period that will be displayed.

Completing the groov View HMI Screen
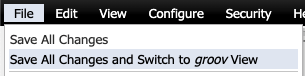
Now that we have our dashboard gadgets on the screen, we will select the File Menu on the upper left, and “Save Changes and Switch to groov View” which will show us the screen and update our values in real-time.
Wrapping Up
We hope this brief introduction to the groov View platform was productive for you. In all of five minutes, we created a simple dashboard on the PLC screen. Seriously, it took more time to open the Pelican case and plug everything in than it did to build this screen on our groov EPIC learning center!
As the supply chain issues of the world continue to grow and affect what hardware is available, we are starting to use groov View more and more as a completely viable replacement for many systems.
We will dive more into more of the functionality available with groov View in future posts including getting it set up along with Node-RED for a very powerful automation solution.